OPEN-SOURCE SCRIPT
Cập nhật Price vs 200 EMA Indicator
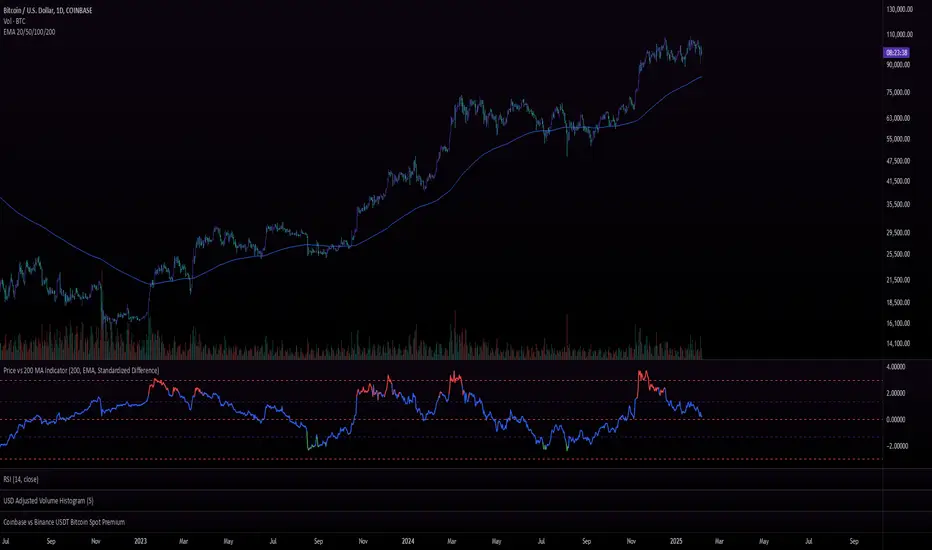
Purpose:
The Price vs. 200 MA (EMA) Indicator measures the deviation of the current price from its 200-period Exponential Moving Average (EMA). Instead of merely plotting the raw difference, the indicator calculates a standardized difference (similar to a z-score), which quantifies the deviation in terms of standard deviations over time. This helps traders understand how extreme the price is relative to its long-term average and its typical volatility.
Use Cases:
Trend Analysis:
Mean Reversion Strategy:
Trend Continuation or Exhaustion:
Summary:
The Price vs. 200 MA (EMA) Indicator calculates the standardized difference (z-score) between the price and its 200-period EMA, giving traders a normalized measure of how far the price is from its long-term average, relative to typical price volatility. The color-coded plot provides a clear visual representation of potential overbought/oversold conditions and highlights when the price has deviated significantly from the 200 EMA in either direction.
The Price vs. 200 MA (EMA) Indicator measures the deviation of the current price from its 200-period Exponential Moving Average (EMA). Instead of merely plotting the raw difference, the indicator calculates a standardized difference (similar to a z-score), which quantifies the deviation in terms of standard deviations over time. This helps traders understand how extreme the price is relative to its long-term average and its typical volatility.
Use Cases:
Trend Analysis:
Traders can use the standardized difference to assess how extreme the current price is relative to its long-term trend (200 EMA) while normalizing for volatility.
When the z-score approaches extreme levels (e.g., above 2 or below -2), it may indicate that the asset is overextended in either direction.
Mean Reversion Strategy:
Since the indicator identifies when the price deviates far from the 200 EMA (in terms of standard deviations), traders can use it to time mean-reversion trades, buying when the price is below -2 (oversold) and selling when it’s above +2 (overbought).
Trend Continuation or Exhaustion:
If the price continues to stay above +2 for extended periods, it could indicate a strong trend, whereas a reversion toward the EMA after reaching +2 or -2 could signal trend exhaustion or reversal.
Summary:
The Price vs. 200 MA (EMA) Indicator calculates the standardized difference (z-score) between the price and its 200-period EMA, giving traders a normalized measure of how far the price is from its long-term average, relative to typical price volatility. The color-coded plot provides a clear visual representation of potential overbought/oversold conditions and highlights when the price has deviated significantly from the 200 EMA in either direction.
Phát hành các Ghi chú
Added option to change MA length.Phát hành các Ghi chú
Added lines at 1.33 & -1.33Flags for crossing 0 are defaulted to off
Phát hành các Ghi chú
.Phát hành các Ghi chú
.Mã nguồn mở
Theo đúng tinh thần TradingView, tác giả của tập lệnh này đã công bố nó dưới dạng mã nguồn mở, để các nhà giao dịch có thể xem xét và xác minh chức năng. Chúc mừng tác giả! Mặc dù bạn có thể sử dụng miễn phí, hãy nhớ rằng việc công bố lại mã phải tuân theo Nội Quy.
Thông báo miễn trừ trách nhiệm
Thông tin và các ấn phẩm này không nhằm mục đích, và không cấu thành, lời khuyên hoặc khuyến nghị về tài chính, đầu tư, giao dịch hay các loại khác do TradingView cung cấp hoặc xác nhận. Đọc thêm tại Điều khoản Sử dụng.
Mã nguồn mở
Theo đúng tinh thần TradingView, tác giả của tập lệnh này đã công bố nó dưới dạng mã nguồn mở, để các nhà giao dịch có thể xem xét và xác minh chức năng. Chúc mừng tác giả! Mặc dù bạn có thể sử dụng miễn phí, hãy nhớ rằng việc công bố lại mã phải tuân theo Nội Quy.
Thông báo miễn trừ trách nhiệm
Thông tin và các ấn phẩm này không nhằm mục đích, và không cấu thành, lời khuyên hoặc khuyến nghị về tài chính, đầu tư, giao dịch hay các loại khác do TradingView cung cấp hoặc xác nhận. Đọc thêm tại Điều khoản Sử dụng.