OPEN-SOURCE SCRIPT
Seasonality Charts
How to use: open monthly chart
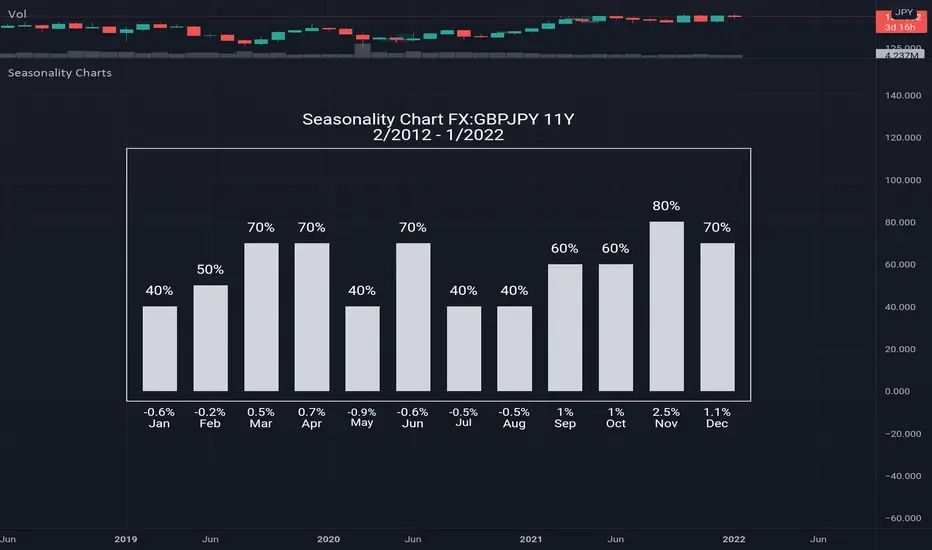
What this chart show: The seasonality tool calculates two numbers: the percentage of time that the month is positive above histogram and the average gain/loss for the month below histogram
Seasonality tells us what has happened in the past, which is the historical tendency. There is certainly no guarantee that past performance will equal future performance, but traders can look for above average tendencies to complement other signals. On the face of it, a bullish bias is present when a security shows gains more than 50% of the time for a particular month. Conversely, a bearish bias is present when a security rises less than 50% of the time. While 50% represents the exact middle, chartists should look for more extreme readings that suggest a relatively strong tendency.
Mã nguồn mở
Theo đúng tinh thần TradingView, tác giả của tập lệnh này đã công bố nó dưới dạng mã nguồn mở, để các nhà giao dịch có thể xem xét và xác minh chức năng. Chúc mừng tác giả! Mặc dù bạn có thể sử dụng miễn phí, hãy nhớ rằng việc công bố lại mã phải tuân theo Nội quy.
Thông báo miễn trừ trách nhiệm
Thông tin và các ấn phẩm này không nhằm mục đích, và không cấu thành, lời khuyên hoặc khuyến nghị về tài chính, đầu tư, giao dịch hay các loại khác do TradingView cung cấp hoặc xác nhận. Đọc thêm tại Điều khoản Sử dụng.