PROTECTED SOURCE SCRIPT
Cập nhật Versailles
Versailles Trading System User Manual
System functions
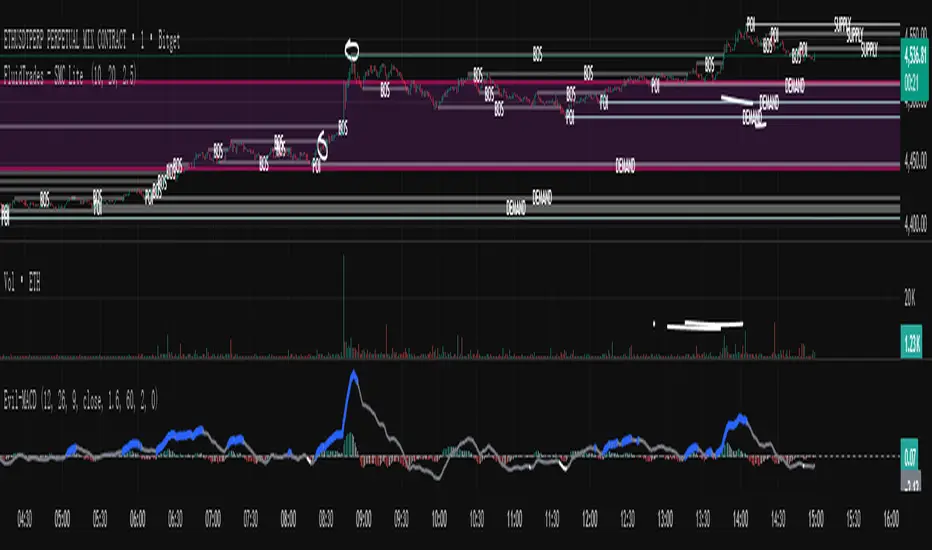
Main line (blue): represents the average cost line
Channel strip (green): normal price fluctuation range
EMA200 (yellow): 200 day moving average, used to determine long-term trends
Simple usage
Long signal (buy)
The price is above the blue line of the main line
The price is above the yellow EMA200
Price hits the green channel and rebounds below the track
Short selling signal (sell)
The price is below the blue line of the main line
The price is below the yellow EMA200
The price has hit the green channel and fallen back
Setting instructions
Anchoring period: usually select "Session" (calculated on a daily basis)
Display EMA200: Turn on the switch and select yellow color
Channel multiplier: Use the default 1.0
Usage Tips
Long above the blue line (main line) and short below it
The yellow line (EMA200) is a trend direction reference
The boundary of the green channel is the support resistance level
Breaking through the outer edge of the price channel may lead to a major market trend
Precautions
The effect is better when the trend is obvious
Less trading in volatile market conditions
More accurate based on trading volume
Set stop loss before operation
In summary, go long above the blue and yellow lines, go short below them, and find buying and selling points along the green channel boundary.
System functions
Main line (blue): represents the average cost line
Channel strip (green): normal price fluctuation range
EMA200 (yellow): 200 day moving average, used to determine long-term trends
Simple usage
Long signal (buy)
The price is above the blue line of the main line
The price is above the yellow EMA200
Price hits the green channel and rebounds below the track
Short selling signal (sell)
The price is below the blue line of the main line
The price is below the yellow EMA200
The price has hit the green channel and fallen back
Setting instructions
Anchoring period: usually select "Session" (calculated on a daily basis)
Display EMA200: Turn on the switch and select yellow color
Channel multiplier: Use the default 1.0
Usage Tips
Long above the blue line (main line) and short below it
The yellow line (EMA200) is a trend direction reference
The boundary of the green channel is the support resistance level
Breaking through the outer edge of the price channel may lead to a major market trend
Precautions
The effect is better when the trend is obvious
Less trading in volatile market conditions
More accurate based on trading volume
Set stop loss before operation
In summary, go long above the blue and yellow lines, go short below them, and find buying and selling points along the green channel boundary.
Phát hành các Ghi chú
Main modifications:Added deviation parameter settings:
Deviation from the backtracking cycle
Display deviation switch
Back offline color settings
Improved deviation detection logic:
Record price highs and corresponding MACD values
Record the price low point and corresponding MACD value
Detecting top deviation (price hitting new high but MACD not hitting new high)
Detecting bottom deviation (price hitting a new low but MACD not hitting a new low)
Back offline drawing:检测顶背离(价格创新高但MACD未创新高)
检测底背离(价格创新低但MACD未创新低)
背离线绘制:
使用不同颜色的连线显示背离
只在检测到有效背离时绘制
限制在回溯周期内检测
这个背离逻辑应该能够正确识别价格与MACD指标之间的背离关系,并在图表上用连线清晰显示出来。您可以根据需要调整背离回溯周期和颜色设置。
Mã được bảo vệ
Tập lệnh này được đăng dưới dạng mã nguồn đóng. Tuy nhiên, bạn có thể tự do sử dụng tập lệnh mà không có bất kỳ hạn chế nào – tìm hiểu thêm tại đây.
Thông báo miễn trừ trách nhiệm
Thông tin và ấn phẩm không có nghĩa là và không cấu thành, tài chính, đầu tư, kinh doanh, hoặc các loại lời khuyên hoặc khuyến nghị khác được cung cấp hoặc xác nhận bởi TradingView. Đọc thêm trong Điều khoản sử dụng.