PROTECTED SOURCE SCRIPT
Cập nhật True Range(TR) + Average True Range (ATR) COMBINED
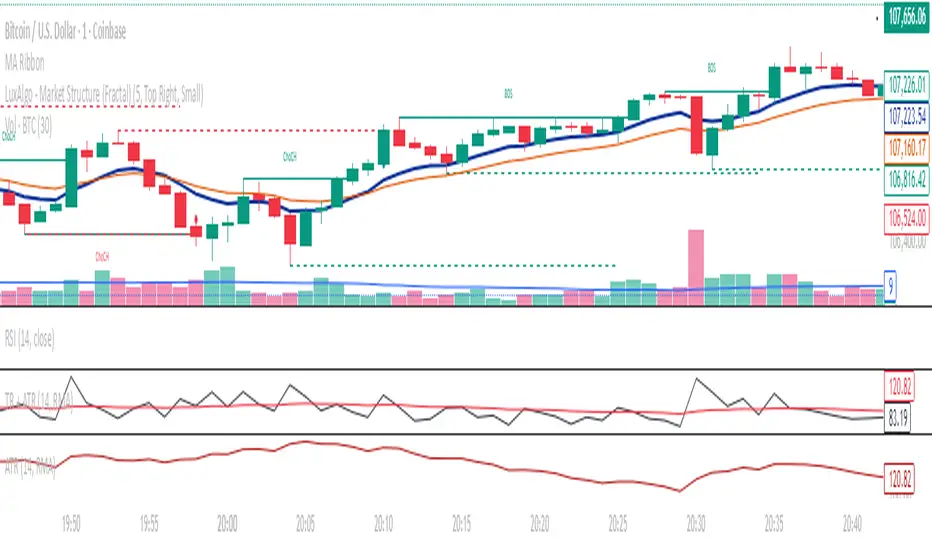
This indicator combines True Range (TR) and Average True Range (ATR) into a single panel for a clearer understanding of price volatility.
True Range (TR) measures the absolute price movement between highs, lows, and previous closes — showing raw, unsmoothed volatility.
Average True Range (ATR) is a moving average of the True Range, providing a smoother, more stable volatility signal.
📊 Usage Tips:
High TR/ATR values indicate strong price movement or volatility expansion.
Low values suggest compression or a potential volatility breakout zone.
Can be used for stop-loss placement, volatility filters, or trend strength confirmation.
⚙️ Features:
Multiple smoothing methods: RMA, SMA, EMA, WMA.
Adjustable ATR length.
Separate colored plots for TR (yellow) and ATR (red).
Works across all timeframes and instruments.
Phát hành các Ghi chú
This indicator combines True Range (TR) and Average True Range (ATR) into a single panel for a clearer understanding of price volatility.True Range (TR) measures the absolute price movement between highs, lows, and previous closes — showing raw, unsmoothed volatility.
Average True Range (ATR) is a moving average of the True Range, providing a smoother, more stable volatility signal.
📊 Usage Tips:
High TR/ATR values indicate strong price movement or volatility expansion.
Low values suggest compression or a potential volatility breakout zone.
Can be used for stop-loss placement, volatility filters, or trend strength confirmation.
⚙️ Features:
Multiple smoothing methods: RMA, SMA, EMA, WMA.
Adjustable ATR length.
Separate colored plots for TR (yellow) and ATR (red).
Works across all timeframes and instruments.
Mã được bảo vệ
Tập lệnh này được đăng dưới dạng mã nguồn đóng. Tuy nhiên, bạn có thể sử dụng tự do và không giới hạn – tìm hiểu thêm tại đây.
Thông báo miễn trừ trách nhiệm
Thông tin và các ấn phẩm này không nhằm mục đích, và không cấu thành, lời khuyên hoặc khuyến nghị về tài chính, đầu tư, giao dịch hay các loại khác do TradingView cung cấp hoặc xác nhận. Đọc thêm tại Điều khoản Sử dụng.