PROTECTED SOURCE SCRIPT
Cập nhật Lite Trading Diary : equity curve
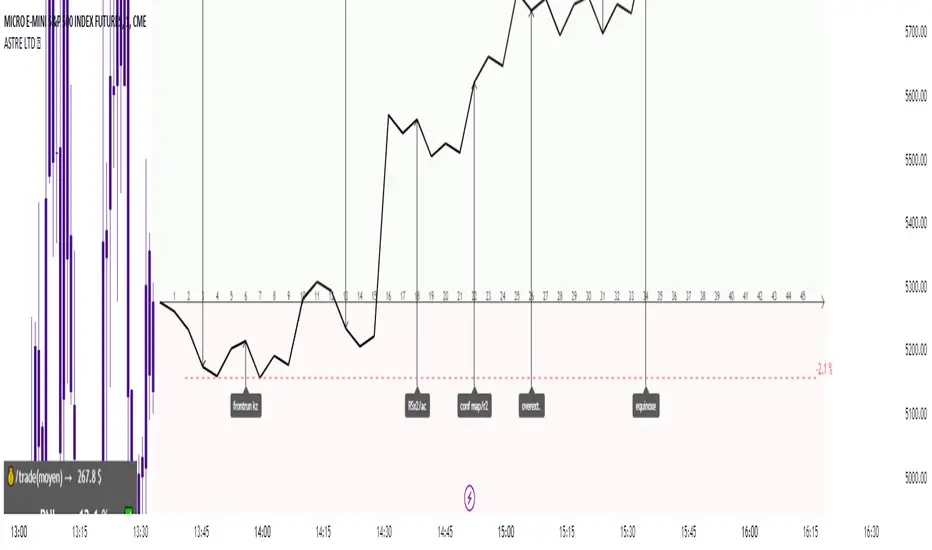
Dynamic trading journal with equity curve display. Detailed results with prop firm objectives, editable, $/month estimation, possibility to compare two strategies.
one line in parameter = one trade.
For each trade, specify : RR (Win, or "-1" for a stoploss), type of trade, and a comment.
The bottom left table summarizes the overall performance with some key information. RA return => Risk adjusted performance.
there is the possibility to define a "Type" : type 1, 2 or 3. It allows to split the equity curve. You can thus distinguish the different sub-strategies of your strategy, visually see their effectiveness, and be able to adjust your risk exposure accordingly.
Learn from your backtests. Identify your strengths, your weaknesses, and improve!
All the conditions to succeed in the challenge are adjustable in the parameters. Please note : drawdown on the equity curve is max drawdown. On the table => static drawdown.
Use "A random day trading" indicator to spice up your training.
I hope this will be useful for you to track your performance !
Phát hành các Ghi chú
fix pictureMã được bảo vệ
Tập lệnh này được đăng dưới dạng mã nguồn đóng. Tuy nhiên, bạn có thể sử dụng tự do và không giới hạn – tìm hiểu thêm tại đây.
Most aggressive TradingView/MT4/MT5 trading setup on the market. Pure juice concentrated from SMC/ICT, divergences and PA!
Snipe the institutional levels! 🐋🏹
Snipe the institutional levels! 🐋🏹
Thông báo miễn trừ trách nhiệm
Thông tin và các ấn phẩm này không nhằm mục đích, và không cấu thành, lời khuyên hoặc khuyến nghị về tài chính, đầu tư, giao dịch hay các loại khác do TradingView cung cấp hoặc xác nhận. Đọc thêm tại Điều khoản Sử dụng.
Mã được bảo vệ
Tập lệnh này được đăng dưới dạng mã nguồn đóng. Tuy nhiên, bạn có thể sử dụng tự do và không giới hạn – tìm hiểu thêm tại đây.
Most aggressive TradingView/MT4/MT5 trading setup on the market. Pure juice concentrated from SMC/ICT, divergences and PA!
Snipe the institutional levels! 🐋🏹
Snipe the institutional levels! 🐋🏹
Thông báo miễn trừ trách nhiệm
Thông tin và các ấn phẩm này không nhằm mục đích, và không cấu thành, lời khuyên hoặc khuyến nghị về tài chính, đầu tư, giao dịch hay các loại khác do TradingView cung cấp hoặc xác nhận. Đọc thêm tại Điều khoản Sử dụng.