OPEN-SOURCE SCRIPT
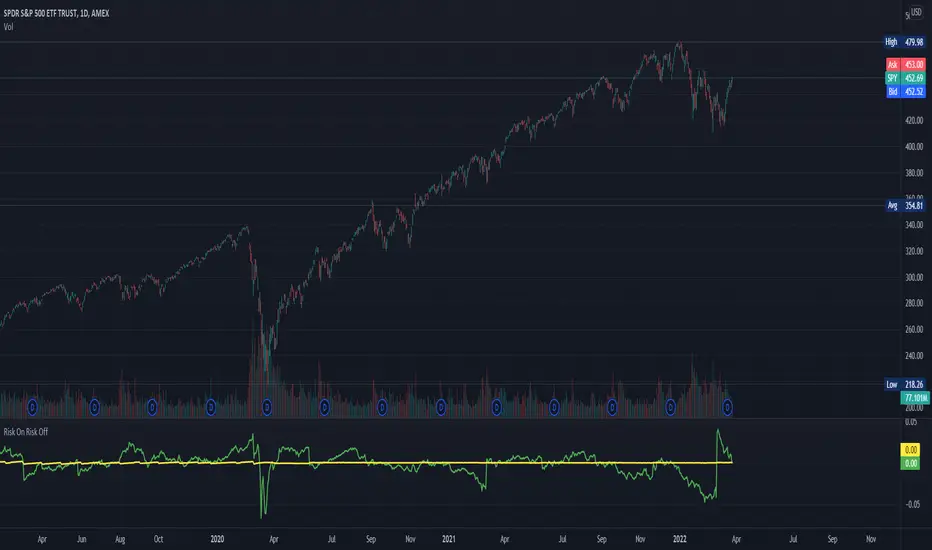
Risk On Risk Off

A helpful indicator for those who follow a systematic long-term investment approach.
What it shows:
It shows the 60 Day Cumulative Return of BND Vanguard Total Bond Market ETF against the 60 Day Cumulative Return of
  BIL SPDR Bloomberg Barclays 1-3 Month T-Bill ETF.
Why:
This Indicator will provide you a sense of where the economic environment is at, if the indicator shows that the 60 Day Cumulative return of BND is ABOVE
  BIL, it means that it's a good idea to go Risk ON in the stock market; On the other hand, if the inverse is true, it means that is a good idea to go Risk OFF in the stock market.
Example Uses:
Warren Buffet often advice Investors to just buy a S&P500 index tracking ETF like SPY consistently and you will likely to be making money in the long-term.
With this indicator you will be able to make the Buffet Strategy even simpler: when the indicator shows Risk ON, buy the SPY; when the indicator shows Risk OFF, consider hedges like
  IEF iShares 7-10 Year Treasury Bond ETF.
 SPY
SPY
What it shows:
It shows the 60 Day Cumulative Return of
Why:
This Indicator will provide you a sense of where the economic environment is at, if the indicator shows that the 60 Day Cumulative return of
Example Uses:
Warren Buffet often advice Investors to just buy a S&P500 index tracking ETF like
With this indicator you will be able to make the Buffet Strategy even simpler: when the indicator shows Risk ON, buy the
Mã nguồn mở
Theo đúng tinh thần TradingView, tác giả của tập lệnh này đã công bố nó dưới dạng mã nguồn mở, để các nhà giao dịch có thể xem xét và xác minh chức năng. Chúc mừng tác giả! Mặc dù bạn có thể sử dụng miễn phí, hãy nhớ rằng việc công bố lại mã phải tuân theo Nội quy.
Thông báo miễn trừ trách nhiệm
Thông tin và các ấn phẩm này không nhằm mục đích, và không cấu thành, lời khuyên hoặc khuyến nghị về tài chính, đầu tư, giao dịch hay các loại khác do TradingView cung cấp hoặc xác nhận. Đọc thêm tại Điều khoản Sử dụng.