OPEN-SOURCE SCRIPT
1337 Volume
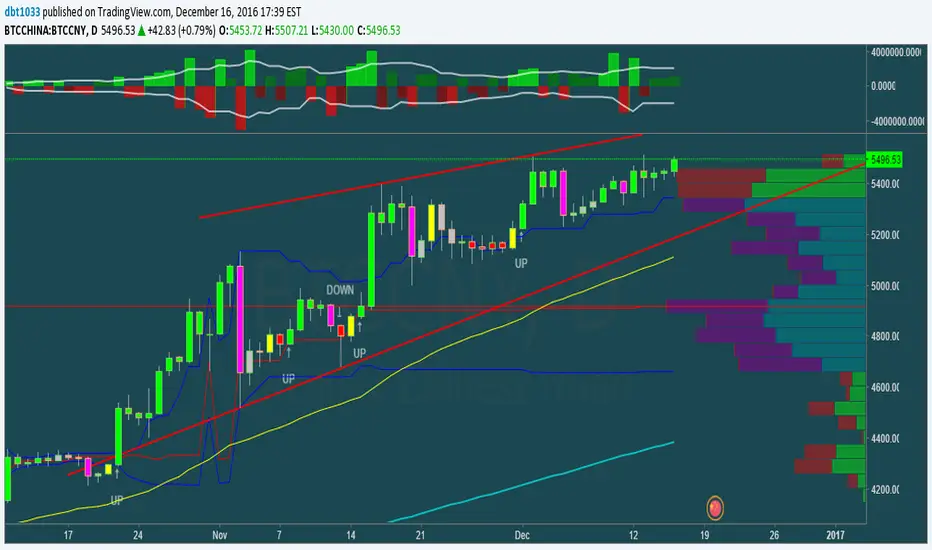
This volume indicator gives you a unique perspective and ability to analyze volume in any market. The upper line that is always >=0 represents average up volume over a user definable period while the lower line that is always <= 0 represents the average down volume over a user definable period.
green == bullish candle but volume lower than average
lime == bullish candle with above average volume
crimson == bearish candle with below average volume
red == bearish candle with above average volume
This indicator is very useful for spotting bottoms / tops (do a visual backtest and observe its behavior) as well as entry opportunities.
By default, the lookback period for average volume is 7, but I encourage you to change this value in order to find settings that work best for your particular market.
If you have any feedback or ideas for improvement, please comment.
Enjoy :D
Mã nguồn mở
Theo đúng tinh thần TradingView, tác giả của tập lệnh này đã công bố nó dưới dạng mã nguồn mở, để các nhà giao dịch có thể xem xét và xác minh chức năng. Chúc mừng tác giả! Mặc dù bạn có thể sử dụng miễn phí, hãy nhớ rằng việc công bố lại mã phải tuân theo Nội quy.
Thông báo miễn trừ trách nhiệm
Thông tin và các ấn phẩm này không nhằm mục đích, và không cấu thành, lời khuyên hoặc khuyến nghị về tài chính, đầu tư, giao dịch hay các loại khác do TradingView cung cấp hoặc xác nhận. Đọc thêm tại Điều khoản Sử dụng.