OPEN-SOURCE SCRIPT
Consecutive count backtester / quantifytools
- Overview
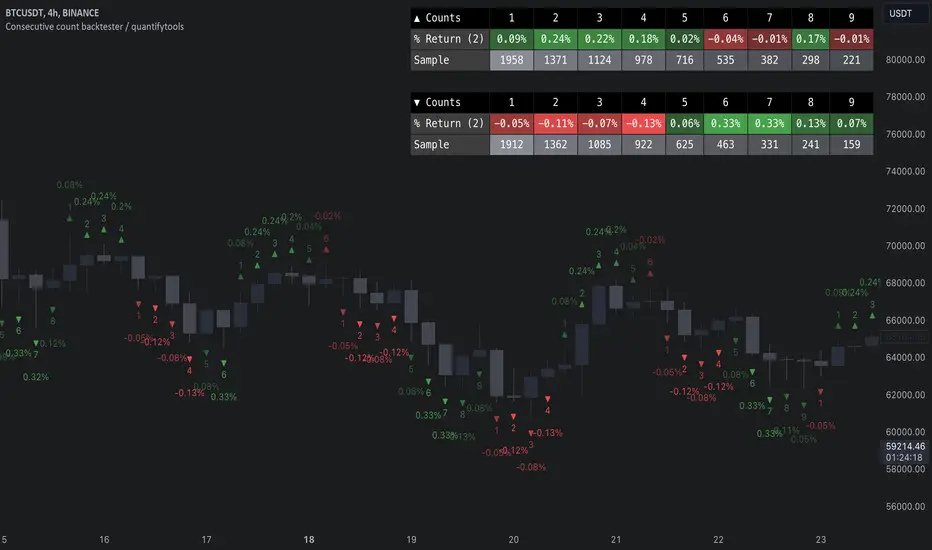
Consecutive counting is a simple method to mechanically define trending states to the upside and downside. Consecutive counts are calculated by taking reference price level (e.g. close 4 candles ago) and count closes above/below it up to a maximum count that resets the consecutive count back to 1. This tool provides the means to backtest each count by measuring % change in price after each count (e.g. % gain 2 candles after a given count).

Users can define reference source that starts the consecutive count (e.g. close 4 candles ago), maximum count where counter resets (e.g. after 9th count) and backtesting period (e.g. price change 2 candles after count).

Filters add extra conditions that must be met on the consecutive count to qualify as valid, which are also reflected on the backtest metrics. The counts can be refined using the following filters:
- RSI above/below X
- Price above/below/at moving average of choice
- Relative volume above/below X

Average gain corresponding to each count as they occur can be toggled off for less clutter. Average price change can also be visualized using candle color. Colors, gradient and table/label sizes are fully customizable.

- Practical guide
Example #1: Identify reversal potential
Consecutive counting is a simple yet effective method to for detecting reversals, for which 7-9 counts are traditionally used. Whether that holds true or not can now be put through a test with different variations of the method as well as using additional filters to improve the probability of a turn.


Example #2: Identify trend following potential
Consecutive counts can also have utility value for trend following. When historical short term change is to the downside, expect downside, when to the upside, expect upside.

Consecutive counting is a simple method to mechanically define trending states to the upside and downside. Consecutive counts are calculated by taking reference price level (e.g. close 4 candles ago) and count closes above/below it up to a maximum count that resets the consecutive count back to 1. This tool provides the means to backtest each count by measuring % change in price after each count (e.g. % gain 2 candles after a given count).
Users can define reference source that starts the consecutive count (e.g. close 4 candles ago), maximum count where counter resets (e.g. after 9th count) and backtesting period (e.g. price change 2 candles after count).
Filters add extra conditions that must be met on the consecutive count to qualify as valid, which are also reflected on the backtest metrics. The counts can be refined using the following filters:
- RSI above/below X
- Price above/below/at moving average of choice
- Relative volume above/below X
Average gain corresponding to each count as they occur can be toggled off for less clutter. Average price change can also be visualized using candle color. Colors, gradient and table/label sizes are fully customizable.
- Practical guide
Example #1: Identify reversal potential
Consecutive counting is a simple yet effective method to for detecting reversals, for which 7-9 counts are traditionally used. Whether that holds true or not can now be put through a test with different variations of the method as well as using additional filters to improve the probability of a turn.
Example #2: Identify trend following potential
Consecutive counts can also have utility value for trend following. When historical short term change is to the downside, expect downside, when to the upside, expect upside.
Mã nguồn mở
Theo đúng tinh thần TradingView, tác giả của tập lệnh này đã công bố nó dưới dạng mã nguồn mở, để các nhà giao dịch có thể xem xét và xác minh chức năng. Chúc mừng tác giả! Mặc dù bạn có thể sử dụng miễn phí, hãy nhớ rằng việc công bố lại mã phải tuân theo Nội quy.
✨ Get instant access to Premium Toolstack for Free: Liquidity prints, Price based concepts and Liquidity composition
✨ Start 7-Day Free Trial: quantify.tools
Watch video tutorials covering our tools on Youtube ↓
✨ Start 7-Day Free Trial: quantify.tools
Watch video tutorials covering our tools on Youtube ↓
Thông báo miễn trừ trách nhiệm
Thông tin và các ấn phẩm này không nhằm mục đích, và không cấu thành, lời khuyên hoặc khuyến nghị về tài chính, đầu tư, giao dịch hay các loại khác do TradingView cung cấp hoặc xác nhận. Đọc thêm tại Điều khoản Sử dụng.