Candles Preview MTF
The script displays a mini-chart with candlesticks from different symbols and timeframes (up to 8 in total). It can display up to 24 candles. You can use it on any timeframe, but it is intended to work with the same or higher timeframes than the chart's. For example: you can add a mini-chart displaying candles of the chart's symbol from Weekly timeframe, while being on Daily timeframe. The script updates in realtime, but it is not recommended to use it on very low timeframes (1 second for example).
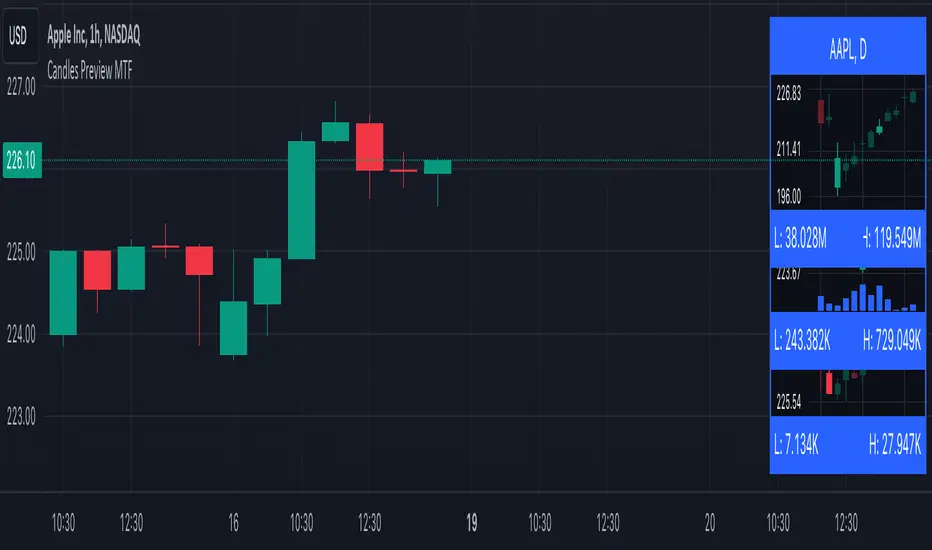
Below you can find some examples of using the indicator:
https://www.tradingview.com/x/2XKBLERi/
(custom colors, highest and lowest volume in footer, symbol name with exchange in header)
(a chart with Weekly and a chart with Monthly candles, custom colors, no footer, timeframe in header)
(charts for 5 different stocks, no footer, symbol name in header)
Along with the chart it displays a header with Symbol and Timeframe, as well as footer with highest and lowest Price or Volume for selected number of candles. Each candle displays a tooltip with the following information when hovered:
- Date / Time
- Open, High, Low and Close prices
- Price change (absolute and %)
- Volume
- Volume change (absolute and %)
By default the interface changes colors if you switch to / from "Dark mode", but you can also manually customise any colors to your likings. You can also hide both header and footer, customise what information is displayed in them, show / hide the chart's grid and change its "density", choose position and height for each of the 8 charts. Additionally, you can change the timezone used to calculate time and date.
Inputs:
The indicator's inputs are separated into groups:
- Other (contains the "Timezone" parameter)
- Chart 1 (contains parameters specific for each chart)
- Chart 2
- Chart N
- ...
- Charts (contains parameters that modify all the 8 charts)
- Colors (contains parameters for styling)
How to get it:
Contact me on Tradingview using private chat, and I will grant you a 3 day trial access
On a side note:
You can share your feedback or ideas in the comments, it will help me improve the indicator. Refer to "Release notes" section for any future updates. Thank you!
17 Aug 2024:
- added support for lower timeframes (including second-based)
- number of charts lowered to 3
- added price scale
- added volume chart
- candle highlighting based on Lowest / Highest price, volume, Rising / Falling volume
- added options to customise candle size, spacing, etc.
Tập lệnh chỉ hiển thị cho người được mời
Chỉ những người dùng được tác giả chấp thuận mới có thể truy cập tập lệnh này. Bạn sẽ cần yêu cầu và được cấp quyền sử dụng. Thông thường quyền này được cấp sau khi thanh toán. Để biết thêm chi tiết, làm theo hướng dẫn của tác giả bên dưới hoặc liên hệ trực tiếp với sabricat.
TradingView KHÔNG khuyến nghị bạn trả phí hoặc sử dụng một tập lệnh trừ khi bạn hoàn toàn tin tưởng vào tác giả và hiểu cách hoạt động của tập lệnh. Bạn cũng có thể tìm các lựa chọn miễn phí, mã nguồn mở trong các script cộng đồng của chúng tôi.
Hướng dẫn của tác giả
Thông báo miễn trừ trách nhiệm
Tập lệnh chỉ hiển thị cho người được mời
Chỉ những người dùng được tác giả chấp thuận mới có thể truy cập tập lệnh này. Bạn sẽ cần yêu cầu và được cấp quyền sử dụng. Thông thường quyền này được cấp sau khi thanh toán. Để biết thêm chi tiết, làm theo hướng dẫn của tác giả bên dưới hoặc liên hệ trực tiếp với sabricat.
TradingView KHÔNG khuyến nghị bạn trả phí hoặc sử dụng một tập lệnh trừ khi bạn hoàn toàn tin tưởng vào tác giả và hiểu cách hoạt động của tập lệnh. Bạn cũng có thể tìm các lựa chọn miễn phí, mã nguồn mở trong các script cộng đồng của chúng tôi.