OPEN-SOURCE SCRIPT
Quadratic MA
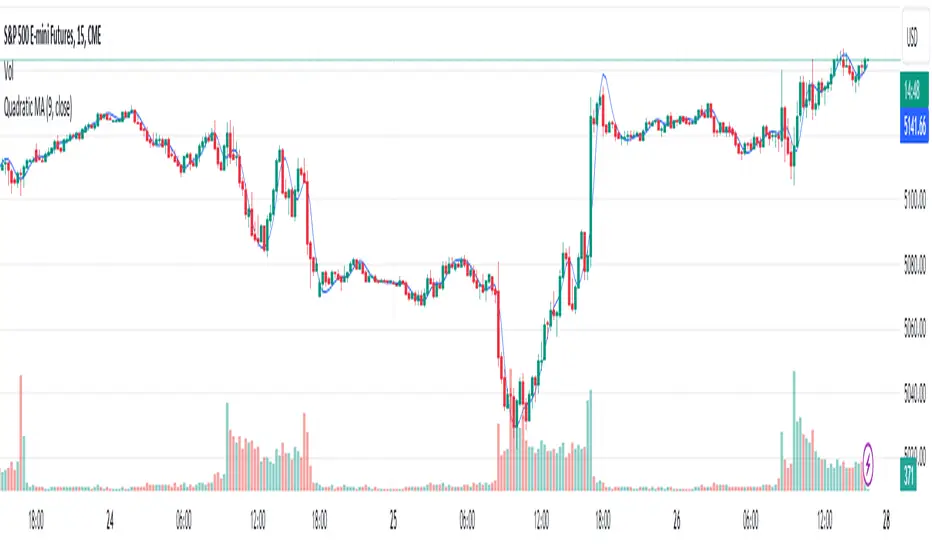
The Quadratic Moving Average (QMA) is an advanced smoothing indicator that provides a smoother and more responsive moving average by applying the Weighted Moving Average (WMA) methodology in a unique, multi-layered approach. This indicator is especially useful for identifying trends in highly volatile markets where data points vary significantly.
Calculation:
The QMA is calculated by first determining a basic WMA over half the specified period and then modifying it by subtracting the WMA over the full period, effectively emphasizing recent price changes. This result is then re-smoothed using another WMA function applied over the square root of the specified length, providing a quadratic enhancement to the typical WMA.
Usage:
The QMA can be particularly effective in trend-following strategies. When the price moves above the QMA line, it may indicate a bullish trend, suggesting a potential buy signal. Conversely, if the price falls below the QMA line, it may signal a bearish trend, indicating a potential sell signal.
Settings:
Length: Controls the sensitivity of the QMA to price changes. A shorter length will make the QMA more responsive to price changes, while a longer length will smooth out the moving average further, potentially reducing the number of signals and noise.
Tips:
Combine the QMA with other forms of analysis, such as volume indicators or momentum oscillators, to confirm trends and refine trading signals.
Adjust the length parameter according to your trading style and the asset's volatility to optimize performance.
Mã nguồn mở
Theo đúng tinh thần TradingView, tác giả của tập lệnh này đã công bố nó dưới dạng mã nguồn mở, để các nhà giao dịch có thể xem xét và xác minh chức năng. Chúc mừng tác giả! Mặc dù bạn có thể sử dụng miễn phí, hãy nhớ rằng việc công bố lại mã phải tuân theo Nội quy.
Thông báo miễn trừ trách nhiệm
Thông tin và các ấn phẩm này không nhằm mục đích, và không cấu thành, lời khuyên hoặc khuyến nghị về tài chính, đầu tư, giao dịch hay các loại khác do TradingView cung cấp hoặc xác nhận. Đọc thêm tại Điều khoản Sử dụng.