OPEN-SOURCE SCRIPT
Cập nhật DEMARSI
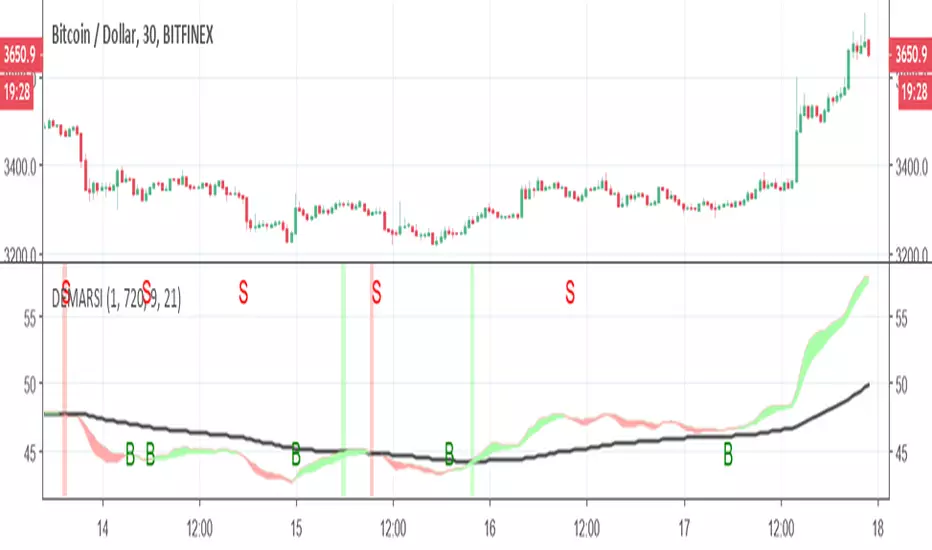
This is little tricky indicator but you need to understand how its work in order to make it easy to understand
The black line is DEMA RSI hybrid which is made on the MTF length that is not repainting.
The green and red zones are also DEMA RSI that is calculated in different way (the cross between the fast and the slow moving create the color change and the signal.
you can buy or sell using the signals shown (no alerts given) but it easy to add. the since the first MTF DEMA RSI is slower the the other ones we can use it as base . so lets say you enter in green and the second DEMA is still above the black line the trend is still forward and even if you get sell signal you still can hold the coin as it expected to rise further . on the other hand once you get sell signal in red and its fall down bellow black line then it the true end of the buy period. you need to find best condition for your purpose which mean to play with setting (here I put 240 MTF over rsiDEma kegth 21) , other options can be better (did not test it).

here without the cross signals of dema rsi 2

here with MTF 120
The black line is DEMA RSI hybrid which is made on the MTF length that is not repainting.
The green and red zones are also DEMA RSI that is calculated in different way (the cross between the fast and the slow moving create the color change and the signal.
you can buy or sell using the signals shown (no alerts given) but it easy to add. the since the first MTF DEMA RSI is slower the the other ones we can use it as base . so lets say you enter in green and the second DEMA is still above the black line the trend is still forward and even if you get sell signal you still can hold the coin as it expected to rise further . on the other hand once you get sell signal in red and its fall down bellow black line then it the true end of the buy period. you need to find best condition for your purpose which mean to play with setting (here I put 240 MTF over rsiDEma kegth 21) , other options can be better (did not test it).
here without the cross signals of dema rsi 2
here with MTF 120
Phát hành các Ghi chú
so I add buy and sell alerts on the crossing, I think by increasing MTF to 720 it may work better on 30 min graph but did not tested it Phát hành các Ghi chú
I highlight the cross of the two different demarsi Mã nguồn mở
Theo đúng tinh thần TradingView, tác giả của tập lệnh này đã công bố nó dưới dạng mã nguồn mở, để các nhà giao dịch có thể xem xét và xác minh chức năng. Chúc mừng tác giả! Mặc dù bạn có thể sử dụng miễn phí, hãy nhớ rằng việc công bố lại mã phải tuân theo Nội quy.
Thông báo miễn trừ trách nhiệm
Thông tin và các ấn phẩm này không nhằm mục đích, và không cấu thành, lời khuyên hoặc khuyến nghị về tài chính, đầu tư, giao dịch hay các loại khác do TradingView cung cấp hoặc xác nhận. Đọc thêm tại Điều khoản Sử dụng.
Mã nguồn mở
Theo đúng tinh thần TradingView, tác giả của tập lệnh này đã công bố nó dưới dạng mã nguồn mở, để các nhà giao dịch có thể xem xét và xác minh chức năng. Chúc mừng tác giả! Mặc dù bạn có thể sử dụng miễn phí, hãy nhớ rằng việc công bố lại mã phải tuân theo Nội quy.
Thông báo miễn trừ trách nhiệm
Thông tin và các ấn phẩm này không nhằm mục đích, và không cấu thành, lời khuyên hoặc khuyến nghị về tài chính, đầu tư, giao dịch hay các loại khác do TradingView cung cấp hoặc xác nhận. Đọc thêm tại Điều khoản Sử dụng.