OPEN-SOURCE SCRIPT
Stochastic Moving Average Convergence Divergence (SMACD)
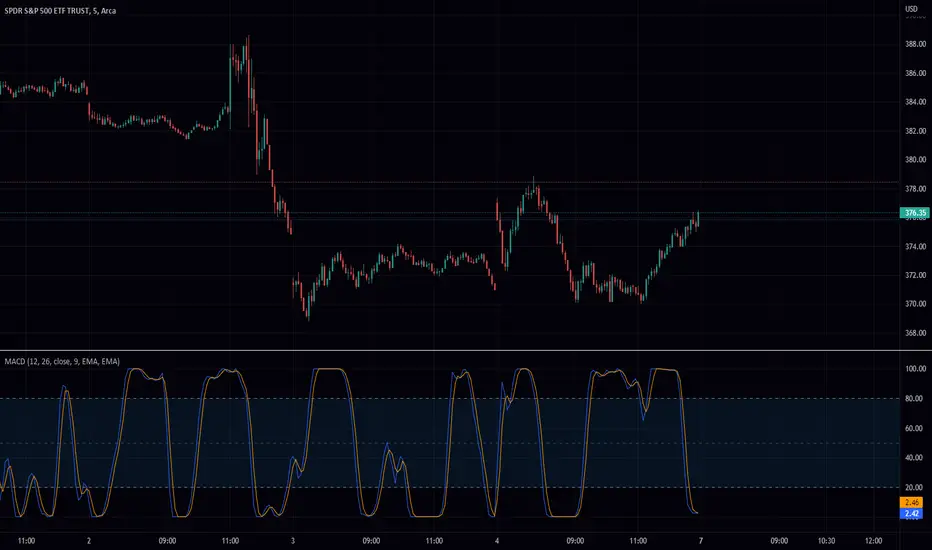
This is my attempt at making a Stochastic MACD indicator. To get this to work I have introduced a DC offset to the MACD histogram output. I figured that if theirs a Stochastic RSI their might as well be a Stochastic everything else! lmao enjoy. Honestly, from what I can tell it's even faster than Stochastic Smooth RSI.
The Stochastic Oscillator (STOCH) is a range bound momentum oscillator. The Stochastic indicator is designed to display the location of the close compared to the high/low range over a user defined number of periods. Typically, the Stochastic Oscillator is used for three things; Identifying overbought and oversold levels, spotting divergences and also identifying bull and bear set ups or signals
MACD is an extremely popular indicator used in technical analysis. MACD can be used to identify aspects of a security's overall trend. Most notably these aspects are momentum, as well as trend direction and duration. What makes MACD so informative is that it is actually the combination of two different types of indicators. First, MACD employs two Moving Averages of varying lengths (which are lagging indicators) to identify trend direction and duration. Then, MACD takes the difference in values between those two Moving Averages (MACD Line) and an EMA of those Moving Averages (Signal Line) and plots that difference between the two lines as a histogram which oscillates above and below a center Zero Line. The histogram is used as a good indication of a security's momentum
Mã nguồn mở
Theo đúng tinh thần TradingView, tác giả của tập lệnh này đã công bố nó dưới dạng mã nguồn mở, để các nhà giao dịch có thể xem xét và xác minh chức năng. Chúc mừng tác giả! Mặc dù bạn có thể sử dụng miễn phí, hãy nhớ rằng việc công bố lại mã phải tuân theo Nội quy.
Thông báo miễn trừ trách nhiệm
Thông tin và các ấn phẩm này không nhằm mục đích, và không cấu thành, lời khuyên hoặc khuyến nghị về tài chính, đầu tư, giao dịch hay các loại khác do TradingView cung cấp hoặc xác nhận. Đọc thêm tại Điều khoản Sử dụng.