OPEN-SOURCE SCRIPT
Trend Reversal Predictor
Trend Reversal Predictor - An Indicator for Identifying Potential Trend Reversals
This indicator is designed to help traders identify potential trend reversals in the financial markets. It combines multiple criteria including trend identification, volume analysis, average net price movement, and RSI (Relative Strength Index) crossing its moving average to highlight potential danger zones where a trend reversal may occur.
How it Works:
1. Trend Identification: The script uses the Hull Moving Average (HMA) and Parabolic SAR to determine the prevailing trend. The HMA is a smoothing indicator that reduces lag and provides a clear representation of the trend direction.
2. Danger Zone Identification: The script analyzes volume-related metrics and average net price movement to identify potential danger zones where trend reversals might occur. It calculates the rate of change of buying and selling volume and compares it to their respective averages. Additionally, it considers the average net price movement over a specified period.
3. RSI Integration: The script incorporates the RSI, a momentum oscillator, to evaluate overbought and oversold conditions. It calculates the RSI based on user-defined length and source inputs. It also calculates the RSI's moving average using different types of moving averages (SMA, EMA, etc.) specified by the user.
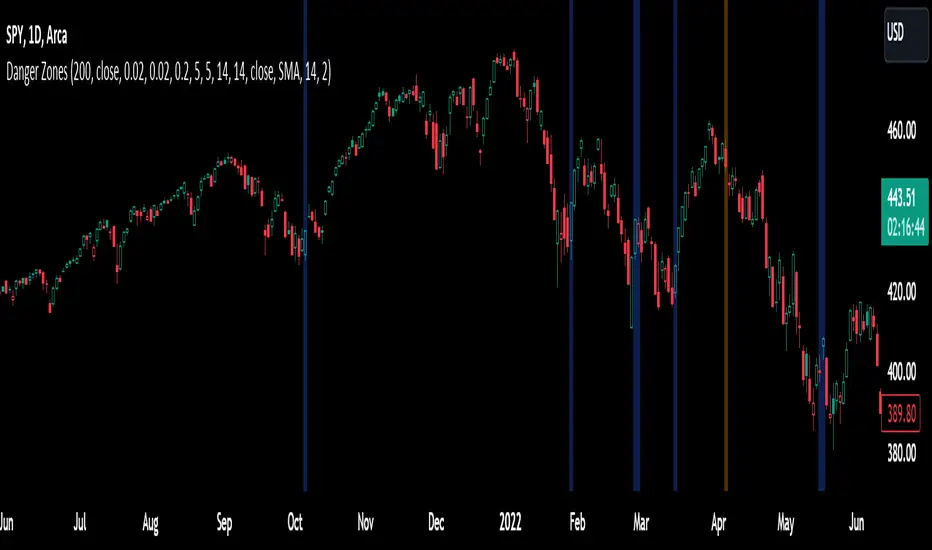
4. Trend Ending Prediction: By combining the conditions of trend identification, volume analysis, average net price movement, and RSI crossing its moving average, the script identifies potential trend reversal points or danger zones. These danger zones are highlighted on the chart using different colors to represent potential uptrend and downtrend reversals.
How to Use:
2. Danger Zone Highlighting: The script highlights potential danger zones on the chart using orange color for uptrend danger zones and blue color for downtrend danger zones. These danger zones suggest areas where a trend reversal may occur.
3. Additional Analysis: Traders can further analyze the danger zones based on their trading strategy and risk management. Consider other technical indicators, price action, and fundamental factors to make informed trading decisions.
Please note that this script provides potential signals for trend reversals but does not guarantee their occurrence. It is important to use this indicator in conjunction with other technical analysis tools and risk management techniques to make well-informed trading decisions.
By understanding the underlying concepts and using the provided visual cues, traders can leverage the Trend Reversal Predictor to potentially identify potential trend reversals in the markets.
This indicator is designed to help traders identify potential trend reversals in the financial markets. It combines multiple criteria including trend identification, volume analysis, average net price movement, and RSI (Relative Strength Index) crossing its moving average to highlight potential danger zones where a trend reversal may occur.
How it Works:
1. Trend Identification: The script uses the Hull Moving Average (HMA) and Parabolic SAR to determine the prevailing trend. The HMA is a smoothing indicator that reduces lag and provides a clear representation of the trend direction.
2. Danger Zone Identification: The script analyzes volume-related metrics and average net price movement to identify potential danger zones where trend reversals might occur. It calculates the rate of change of buying and selling volume and compares it to their respective averages. Additionally, it considers the average net price movement over a specified period.
3. RSI Integration: The script incorporates the RSI, a momentum oscillator, to evaluate overbought and oversold conditions. It calculates the RSI based on user-defined length and source inputs. It also calculates the RSI's moving average using different types of moving averages (SMA, EMA, etc.) specified by the user.
4. Trend Ending Prediction: By combining the conditions of trend identification, volume analysis, average net price movement, and RSI crossing its moving average, the script identifies potential trend reversal points or danger zones. These danger zones are highlighted on the chart using different colors to represent potential uptrend and downtrend reversals.
How to Use:
2. Danger Zone Highlighting: The script highlights potential danger zones on the chart using orange color for uptrend danger zones and blue color for downtrend danger zones. These danger zones suggest areas where a trend reversal may occur.
3. Additional Analysis: Traders can further analyze the danger zones based on their trading strategy and risk management. Consider other technical indicators, price action, and fundamental factors to make informed trading decisions.
Please note that this script provides potential signals for trend reversals but does not guarantee their occurrence. It is important to use this indicator in conjunction with other technical analysis tools and risk management techniques to make well-informed trading decisions.
By understanding the underlying concepts and using the provided visual cues, traders can leverage the Trend Reversal Predictor to potentially identify potential trend reversals in the markets.
Mã nguồn mở
Theo đúng tinh thần TradingView, tác giả của tập lệnh này đã công bố nó dưới dạng mã nguồn mở, để các nhà giao dịch có thể xem xét và xác minh chức năng. Chúc mừng tác giả! Mặc dù bạn có thể sử dụng miễn phí, hãy nhớ rằng việc công bố lại mã phải tuân theo Nội quy.
Thông báo miễn trừ trách nhiệm
Thông tin và các ấn phẩm này không nhằm mục đích, và không cấu thành, lời khuyên hoặc khuyến nghị về tài chính, đầu tư, giao dịch hay các loại khác do TradingView cung cấp hoặc xác nhận. Đọc thêm tại Điều khoản Sử dụng.