OPEN-SOURCE SCRIPT
Cập nhật Quant Signals: Econophysics-based Momentum
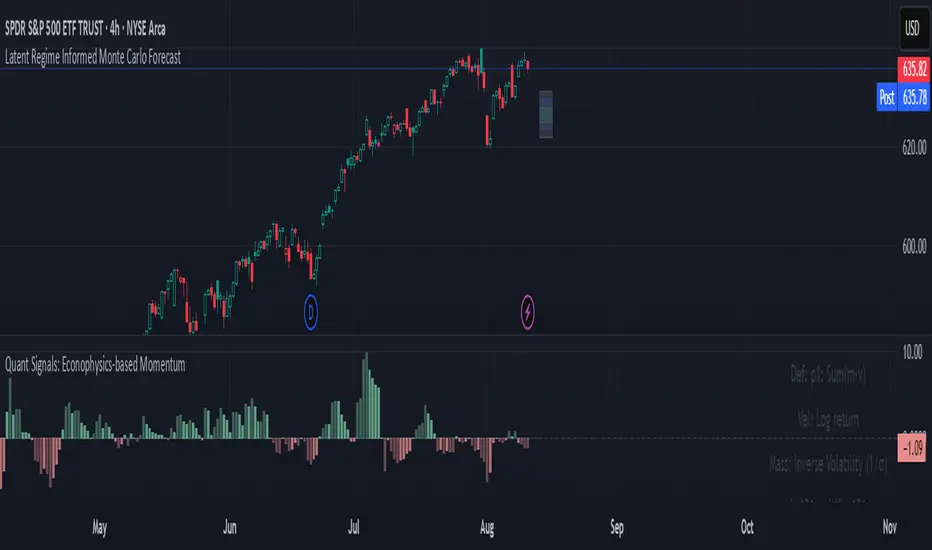
Physical Momentum Switcher (p0 / p1 / p2 / p3)
This indicator implements a “physical momentum” concept from quantitative finance research, where momentum is defined similarly to physics:
Momentum (p) = Mass × Velocity
Instead of using only the standard cumulative return (classic momentum), it lets you switch between multiple definitions:
Velocity can be measured as:
Mass (for p1/p2) can be defined as:
Features:
Typical uses:
Momentum trading: Buy when PM > 0 (or crosses above the signal), sell/short when PM < 0 (or crosses below).
Contrarian strategies: Reverse the logic when testing mean-reversion effects.
Cross-asset testing: Apply to different instruments to see which PM definition works best.
This indicator implements a “physical momentum” concept from quantitative finance research, where momentum is defined similarly to physics:
Momentum (p) = Mass × Velocity
Instead of using only the standard cumulative return (classic momentum), it lets you switch between multiple definitions:
- p0: Cumulative return over the lookback period (no mass, just price change).
- p1: Sum of (mass × velocity) over the lookback period.
- p2: Weighted average velocity = (Σ mass×velocity) ÷ (Σ mass).
- p3: Sharpe-like momentum = average velocity ÷ volatility (massless).
Velocity can be measured as:
- Log return: ln(Pt / Pt-1)
- Normal return: (Pt / Pt-1 – 1)
Mass (for p1/p2) can be defined as:
- Unit mass (1) — equal weighting, equivalent to traditional momentum.
- Turnover proxy — Volume ÷ average volume over k bars.
- Value turnover proxy — Dollar volume ÷ average dollar volume.
- Inverse volatility — 1 ÷ return volatility over a specified period.
Features:
- Switchable momentum definition, velocity type, and mass type.
- Adjustable lookback (k) and smoothing period for the signal line.
- Optional ±1σ display bands for quick overbought/oversold visual cues.
- Alerts for crosses above/below zero or the signal line.
- Table display summarizing current settings and values.
Typical uses:
Momentum trading: Buy when PM > 0 (or crosses above the signal), sell/short when PM < 0 (or crosses below).
Contrarian strategies: Reverse the logic when testing mean-reversion effects.
Cross-asset testing: Apply to different instruments to see which PM definition works best.
Phát hành các Ghi chú
Added histogram viewMã nguồn mở
Theo đúng tinh thần TradingView, tác giả của tập lệnh này đã công bố nó dưới dạng mã nguồn mở, để các nhà giao dịch có thể xem xét và xác minh chức năng. Chúc mừng tác giả! Mặc dù bạn có thể sử dụng miễn phí, hãy nhớ rằng việc công bố lại mã phải tuân theo Nội quy.
Thông báo miễn trừ trách nhiệm
Thông tin và các ấn phẩm này không nhằm mục đích, và không cấu thành, lời khuyên hoặc khuyến nghị về tài chính, đầu tư, giao dịch hay các loại khác do TradingView cung cấp hoặc xác nhận. Đọc thêm tại Điều khoản Sử dụng.
Mã nguồn mở
Theo đúng tinh thần TradingView, tác giả của tập lệnh này đã công bố nó dưới dạng mã nguồn mở, để các nhà giao dịch có thể xem xét và xác minh chức năng. Chúc mừng tác giả! Mặc dù bạn có thể sử dụng miễn phí, hãy nhớ rằng việc công bố lại mã phải tuân theo Nội quy.
Thông báo miễn trừ trách nhiệm
Thông tin và các ấn phẩm này không nhằm mục đích, và không cấu thành, lời khuyên hoặc khuyến nghị về tài chính, đầu tư, giao dịch hay các loại khác do TradingView cung cấp hoặc xác nhận. Đọc thêm tại Điều khoản Sử dụng.