OPEN-SOURCE SCRIPT
EMAs Personalizáveis (até 5)
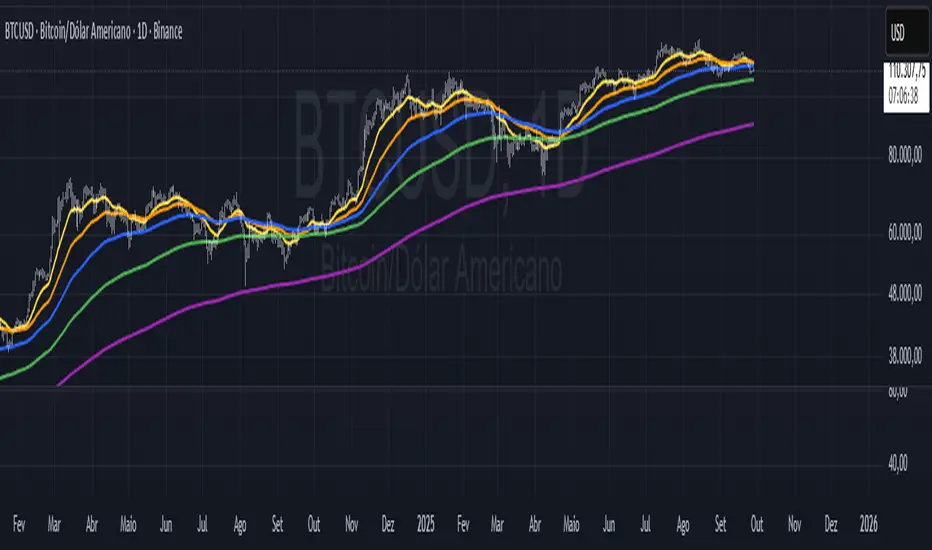
📘 Indicator Explanation – Customizable EMAs (up to 5)
This indicator was developed in Pine Script v6 to make it easier to visualize multiple Exponential Moving Averages (EMAs) on a single chart.
🔑 Main features:
Supports up to 5 different EMAs.
Ability to enable or disable each EMA individually.
Fully customizable period for each EMA.
Flexible color selection for better visual organization.
Adjustable line thickness to highlight the most relevant levels.
📌 How to use:
Open the indicator settings.
Select which EMAs you want to display (from 1 to 5).
Define the period (e.g., 20, 50, 100, 200, etc.).
Choose a color for each EMA.
Observe price behavior relative to the EMAs to identify:
Trends → price above long EMAs indicates bullish strength.
Reversals → EMA crossovers may signal a change in direction.
Dynamic support and resistance → EMAs often act as reaction zones for price.
💡 Practical example:
Short EMA (20) → shows short-term movement.
Mid-term EMA (50 or 100) → confirms trend direction.
Long EMA (200 or 500) → indicates the overall market trend.
👉 This indicator is flexible and can be used for scalping, swing trading, or position trading, depending on the chosen periods.
Mã nguồn mở
Theo đúng tinh thần TradingView, tác giả của tập lệnh này đã công bố nó dưới dạng mã nguồn mở, để các nhà giao dịch có thể xem xét và xác minh chức năng. Chúc mừng tác giả! Mặc dù bạn có thể sử dụng miễn phí, hãy nhớ rằng việc công bố lại mã phải tuân theo Nội quy.
Thông báo miễn trừ trách nhiệm
Thông tin và các ấn phẩm này không nhằm mục đích, và không cấu thành, lời khuyên hoặc khuyến nghị về tài chính, đầu tư, giao dịch hay các loại khác do TradingView cung cấp hoặc xác nhận. Đọc thêm tại Điều khoản Sử dụng.