OPEN-SOURCE SCRIPT
Kawasaki_MFI
Kawasaki_MFI Indicator
The Kawasaki_MFI indicator is a customized technical analysis tool developed to analyze asset prices in financial markets. This script is implemented in TradingView's Pine Script language (version 5) and is based on the concept of the Accumulation/Distribution Line (ADL) which is a volume-based indicator designed to measure the cumulative flow of money into and out of a security.
Script Details
Version: Pine Script version 5
Overlay: True - The indicator is plotted directly on the price chart.
Input Variables
The script utilizes the following input variables sourced from daily (D) time frames:
High (my_high): The highest price of the security in the daily time frame.
Low (my_low): The lowest price of the security in the daily time frame.
Close (my_close): The closing price of the security in the daily time frame.
Volume (my_volume): The trading volume of the security in the daily time frame.
ADL Calculation
The ADL is calculated using the following formula:
ADL
=
Cumulative sum of ((Close−Low)−(High−Close)High−Low×Volume)
ADL=Cumulative sum of ( High−Low(Close−Low)−(High−Close)×Volume)
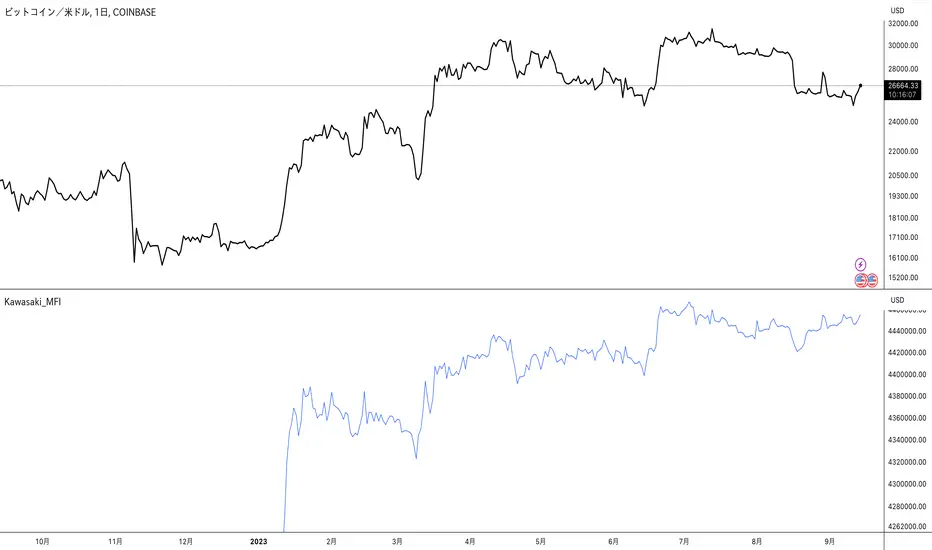
Plot
The ADL line is plotted on the chart with the following characteristics:
Title: ADL
Color: Blue
Usage
Traders can use the Kawasaki_MFI indicator to identify trends and potential reversal points in the market. A rising ADL line suggests buying pressure, while a falling ADL line suggests selling pressure. It can be used in conjunction with other technical indicators to develop a comprehensive trading strategy.
Feel free to add more details or modify the description to better suit your needs.
The Kawasaki_MFI indicator is a customized technical analysis tool developed to analyze asset prices in financial markets. This script is implemented in TradingView's Pine Script language (version 5) and is based on the concept of the Accumulation/Distribution Line (ADL) which is a volume-based indicator designed to measure the cumulative flow of money into and out of a security.
Script Details
Version: Pine Script version 5
Overlay: True - The indicator is plotted directly on the price chart.
Input Variables
The script utilizes the following input variables sourced from daily (D) time frames:
High (my_high): The highest price of the security in the daily time frame.
Low (my_low): The lowest price of the security in the daily time frame.
Close (my_close): The closing price of the security in the daily time frame.
Volume (my_volume): The trading volume of the security in the daily time frame.
ADL Calculation
The ADL is calculated using the following formula:
ADL
=
Cumulative sum of ((Close−Low)−(High−Close)High−Low×Volume)
ADL=Cumulative sum of ( High−Low(Close−Low)−(High−Close)×Volume)
Plot
The ADL line is plotted on the chart with the following characteristics:
Title: ADL
Color: Blue
Usage
Traders can use the Kawasaki_MFI indicator to identify trends and potential reversal points in the market. A rising ADL line suggests buying pressure, while a falling ADL line suggests selling pressure. It can be used in conjunction with other technical indicators to develop a comprehensive trading strategy.
Feel free to add more details or modify the description to better suit your needs.
Mã nguồn mở
Theo đúng tinh thần TradingView, tác giả của tập lệnh này đã công bố nó dưới dạng mã nguồn mở, để các nhà giao dịch có thể xem xét và xác minh chức năng. Chúc mừng tác giả! Mặc dù bạn có thể sử dụng miễn phí, hãy nhớ rằng việc công bố lại mã phải tuân theo Nội quy.
Thông báo miễn trừ trách nhiệm
Thông tin và các ấn phẩm này không nhằm mục đích, và không cấu thành, lời khuyên hoặc khuyến nghị về tài chính, đầu tư, giao dịch hay các loại khác do TradingView cung cấp hoặc xác nhận. Đọc thêm tại Điều khoản Sử dụng.