OPEN-SOURCE SCRIPT
Dynamic Time Zone EMA with Candle Trend Analysis
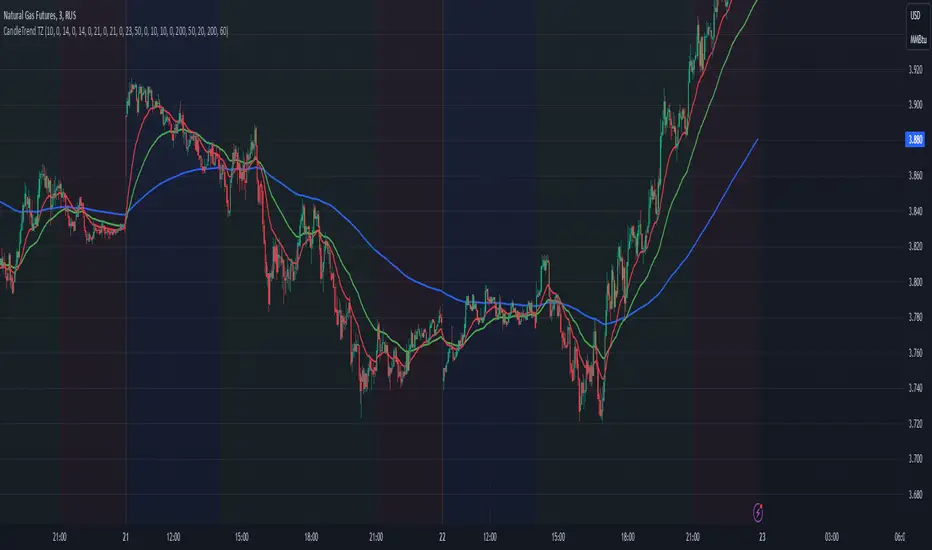
CandleTrend TZ is a powerful analytical tool that integrates time zones, exponential moving averages (EMA), and custom candle coloring based on trend direction. This indicator is ideal for traders looking to analyze market trends within specific time sessions effectively.
Key Features:
Time Zones:
Divides the chart into four distinct time intervals, each highlighted with a unique background color.
Fully customizable start and end times for each interval, allowing for adaptation to various trading schedules.
Exponential Moving Averages (EMA):
Displays three EMAs with user-defined lengths:
EMA 200 (blue) for long-term trends.
EMA 50 (green) for medium-term trends.
EMA 20 (red) for short-term trends.
Helps identify trend direction and strength.
Custom Candle Coloring:
Utilizes smoothed Heiken Ashi and Triple EMA (TEMA) calculations for enhanced candle coloring:
Green candles indicate an upward trend.
Red candles signal a downward trend.
Filters out market noise, providing a clear visual representation of market dynamics.
Customization Options:
Time Zones:
Adjustable start and end times for each of the four sessions:
Input hour and minute for start and end times (e.g., Interval 1 Start/End Hour/Minute).
Background colors are pre-defined but can be modified in the code.
EMAs:
User-defined lengths for each EMA:
EMA 200 Length (default: 200)
EMA 50 Length (default: 50)
EMA 20 Length (default: 20)
TEMA Settings:
Parameters for trend smoothing:
TEMA Length (default: 55)
EMA Length (default: 60)
Use Cases:
Intraday Session Analysis:
Use time zones to differentiate between morning, afternoon, and evening market activity.
The background colors make it easy to track session-specific trends.
Trend Trading:
Analyze EMA crossings and their slopes to confirm market direction.
Green candles indicate buying opportunities, while red candles highlight selling signals.
Noise Reduction:
TEMA smoothing removes market noise, allowing you to focus on the primary market trend.
Adaptation to Custom Strategies:
By adjusting time intervals, you can tailor the indicator to specific trading styles or market conditions.
Benefits:
Versatility for both trending and sideways markets.
Intuitive and user-friendly setup.
Suitable for traders of all skill levels, from beginners to professionals.
CandleTrend TZ is an indispensable tool for understanding market dynamics, enhancing your trading precision, and making well-informed decisions. 🚀
Mã nguồn mở
Theo đúng tinh thần TradingView, tác giả của tập lệnh này đã công bố nó dưới dạng mã nguồn mở, để các nhà giao dịch có thể xem xét và xác minh chức năng. Chúc mừng tác giả! Mặc dù bạn có thể sử dụng miễn phí, hãy nhớ rằng việc công bố lại mã phải tuân theo Nội quy.
Thông báo miễn trừ trách nhiệm
Thông tin và các ấn phẩm này không nhằm mục đích, và không cấu thành, lời khuyên hoặc khuyến nghị về tài chính, đầu tư, giao dịch hay các loại khác do TradingView cung cấp hoặc xác nhận. Đọc thêm tại Điều khoản Sử dụng.