OPEN-SOURCE SCRIPT
Ultra Strong Key Levels
Ultra Strong Key Levels (Volume-Highlighted, Scalable)
This indicator automatically detects very strong support and resistance levels using high-strength pivots combined with clustered volume analysis.
It highlights only the most meaningful levels — those backed by significant volume activity — and visually scales each level based on its importance.
How It Works
Identifies strong pivot highs and lows using a customizable pivot strength.
Calculates clustered volume around each pivot to determine how important that level is.
Filters out weak levels by requiring volume around the pivot to exceed a dynamic threshold.
Draws each valid level with:
Adaptive line width (higher volume = thicker line)
Dynamic color intensity (higher volume = brighter line)
Keeps the chart clean by storing only the 10 most recent strong highs and lows.
Inputs
Pivot Strength — Defines how strong a pivot must be to qualify. Larger values = fewer but more reliable levels.
Volume Multiplier — Adjusts sensitivity to volume around the pivot.
Volume Window — Number of bars before and after the pivot used to calculate cluster volume.
Max Line Width — Upper limit for level thickness.
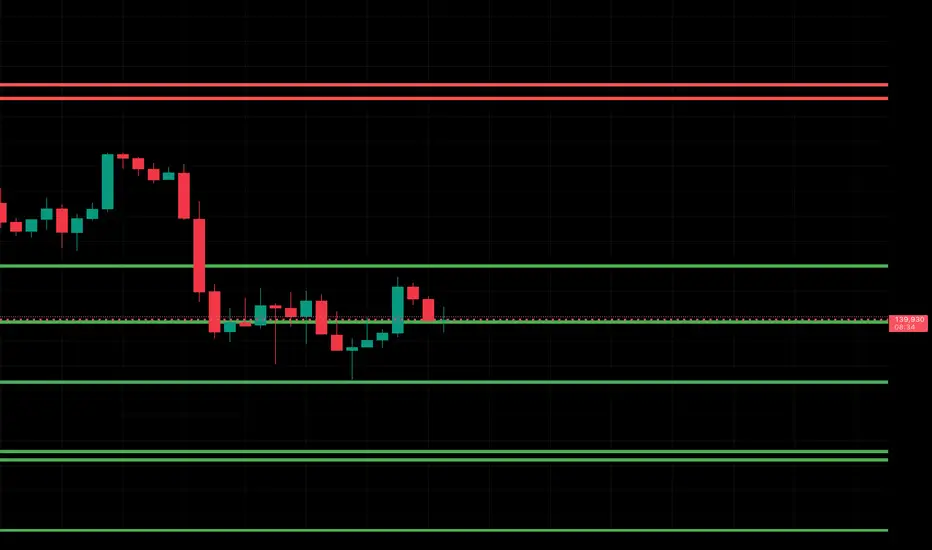
What This Indicator Shows
Red levels = Strong resistance zones (pivot highs with heavy volume)
Green levels = Strong support zones (pivot lows with heavy volume)
Thicker and more intense lines represent higher trading activity, meaning the level is more likely to impact price behavior.
Use Cases
Spot high-value reversal zones
Identify institutional reaction levels
Confirm key breakout/ breakdown points
Combine with trend tools or volume profile for enhanced precision
If you'd like, I can also create:
✓ A shorter version
✓ SEO-optimized TradingView description
✓ A version formatted with bullets, emojis, or markdown style
This indicator automatically detects very strong support and resistance levels using high-strength pivots combined with clustered volume analysis.
It highlights only the most meaningful levels — those backed by significant volume activity — and visually scales each level based on its importance.
How It Works
Identifies strong pivot highs and lows using a customizable pivot strength.
Calculates clustered volume around each pivot to determine how important that level is.
Filters out weak levels by requiring volume around the pivot to exceed a dynamic threshold.
Draws each valid level with:
Adaptive line width (higher volume = thicker line)
Dynamic color intensity (higher volume = brighter line)
Keeps the chart clean by storing only the 10 most recent strong highs and lows.
Inputs
Pivot Strength — Defines how strong a pivot must be to qualify. Larger values = fewer but more reliable levels.
Volume Multiplier — Adjusts sensitivity to volume around the pivot.
Volume Window — Number of bars before and after the pivot used to calculate cluster volume.
Max Line Width — Upper limit for level thickness.
What This Indicator Shows
Red levels = Strong resistance zones (pivot highs with heavy volume)
Green levels = Strong support zones (pivot lows with heavy volume)
Thicker and more intense lines represent higher trading activity, meaning the level is more likely to impact price behavior.
Use Cases
Spot high-value reversal zones
Identify institutional reaction levels
Confirm key breakout/ breakdown points
Combine with trend tools or volume profile for enhanced precision
If you'd like, I can also create:
✓ A shorter version
✓ SEO-optimized TradingView description
✓ A version formatted with bullets, emojis, or markdown style
Mã nguồn mở
Theo đúng tinh thần TradingView, tác giả của tập lệnh này đã công bố nó dưới dạng mã nguồn mở, để các nhà giao dịch có thể xem xét và xác minh chức năng. Chúc mừng tác giả! Mặc dù bạn có thể sử dụng miễn phí, hãy nhớ rằng việc công bố lại mã phải tuân theo Nội Quy.
Thông báo miễn trừ trách nhiệm
Thông tin và các ấn phẩm này không nhằm mục đích, và không cấu thành, lời khuyên hoặc khuyến nghị về tài chính, đầu tư, giao dịch hay các loại khác do TradingView cung cấp hoặc xác nhận. Đọc thêm tại Điều khoản Sử dụng.