PROTECTED SOURCE SCRIPT
Leonidas Volatility Oscillator
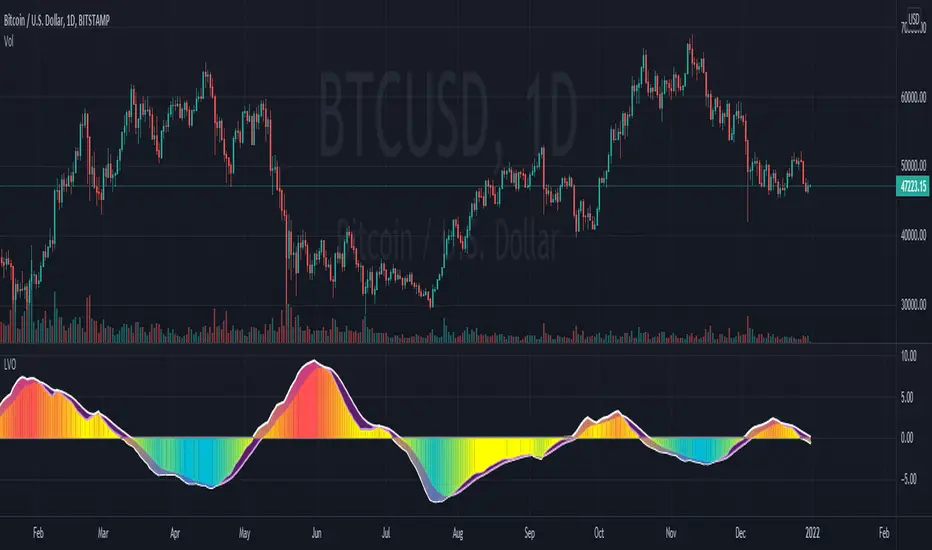
This indicator is showing the volatility based on ATR or Historical Volatility.
Volatility is one of the most powerful tools to catch explosive moves or identify when the market is in consolidation/distribution phase.
How to use this indicator:
Colors:
Blue Color is they most important color for this indicator .
This color is suggesting the volatility is reaching the lowest point the market is in consolidation/distribution phase. Depending of the time frame after this phase you will see an expansion.

Yellow/Red Color
Usually we will see this when the market is trending.

Trend.
This indicator is interesting because you will know if the volatility is trending powerful to keep your positions or ride the trend .

This indicator will not tell you when to sell or buy.
This indicator will help you to identify explosive moves, consolidation/distribution phases.
Volatility is one of the most powerful tools to catch explosive moves or identify when the market is in consolidation/distribution phase.
How to use this indicator:
Colors:
Blue Color is they most important color for this indicator .
This color is suggesting the volatility is reaching the lowest point the market is in consolidation/distribution phase. Depending of the time frame after this phase you will see an expansion.
Yellow/Red Color
Usually we will see this when the market is trending.
Trend.
This indicator is interesting because you will know if the volatility is trending powerful to keep your positions or ride the trend .
This indicator will not tell you when to sell or buy.
This indicator will help you to identify explosive moves, consolidation/distribution phases.
Mã được bảo vệ
Tập lệnh này được đăng dưới dạng mã nguồn đóng. Tuy nhiên, bạn có thể sử dụng tự do và không giới hạn – tìm hiểu thêm tại đây.
Trading for living!
Thông báo miễn trừ trách nhiệm
Thông tin và các ấn phẩm này không nhằm mục đích, và không cấu thành, lời khuyên hoặc khuyến nghị về tài chính, đầu tư, giao dịch hay các loại khác do TradingView cung cấp hoặc xác nhận. Đọc thêm tại Điều khoản Sử dụng.