OPEN-SOURCE SCRIPT
Bullish/Bearish Body Strength
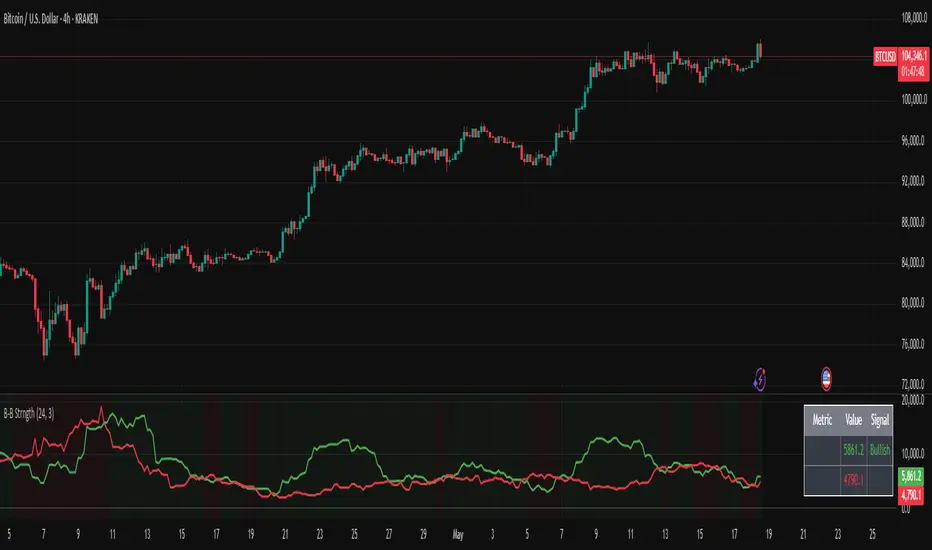
This indicator analyzes candlestick body sizes to measure bullish versus bearish strength over a specified period. Here's what it does:
Features:
- Measures and totals the body sizes of bullish and bearish candles over your chosen lookback period
- Shows the total bullish and bearish body measurements as separate plots
- Calculates and displays a bull/bear ratio (bullish total divided by bearish total)
- Shows the difference between bullish and bearish totals
- Colors the background based on bullish (green) or bearish (red) dominance
- Includes an information table with current values and signals
Customization Options:
- Lookback Period: Set how many bars to analyze (default: 14)
- Normalize by ATR: Option to normalize body sizes by the Average True Range for more consistent measurement across different volatility periods
- Smoothing Period: Apply smoothing to the ratio and difference values
- Display Options: Toggle for showing the bull/bear ratio and bull-bear difference
How to Use:
1. Add the indicator to your chart in TradingView
2. Adjust the lookback period to fit your trading timeframe
3. Watch for:
- When bullish bodies significantly outweigh bearish ones (green dominance)
- When bearish bodies significantly outweigh bullish ones (red dominance)
- Ratio values above 2 (strong bullish signal) or below 0.5 (strong bearish signal)
The indicator provides both visual cues and numerical data to help identify periods of bullish or bearish momentum based on actual price movement rather than just candle count.
Mã nguồn mở
Theo đúng tinh thần TradingView, tác giả của tập lệnh này đã công bố nó dưới dạng mã nguồn mở, để các nhà giao dịch có thể xem xét và xác minh chức năng. Chúc mừng tác giả! Mặc dù bạn có thể sử dụng miễn phí, hãy nhớ rằng việc công bố lại mã phải tuân theo Nội quy.
Thông báo miễn trừ trách nhiệm
Thông tin và các ấn phẩm này không nhằm mục đích, và không cấu thành, lời khuyên hoặc khuyến nghị về tài chính, đầu tư, giao dịch hay các loại khác do TradingView cung cấp hoặc xác nhận. Đọc thêm tại Điều khoản Sử dụng.