OPEN-SOURCE SCRIPT
VWAP Trend
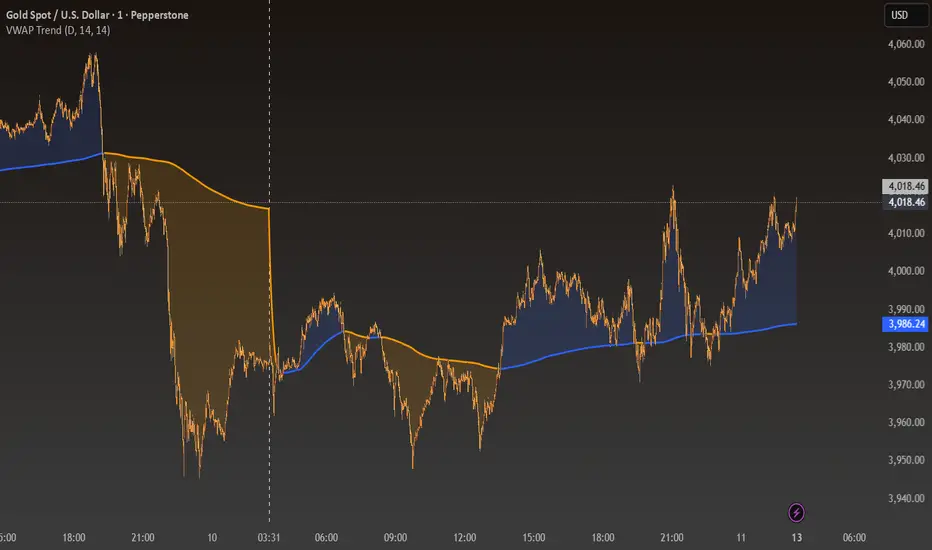
The VWAP Trend indicator is a powerful visualization tool that blends a smoothed Volume-Weighted Average Price (VWAP) with a trend-following EMA to reveal the underlying market bias in a clear, color-coded format.
Unlike a standard VWAP that only resets intraday, VWAP Trend allows traders to anchor VWAP calculations to Daily, Weekly, or Monthly sessions. This flexibility makes it suitable for all trading styles — from intraday scalping to long-term swing analysis.
The smoothed VWAP provides a stable representation of the true average price weighted by volume, while the EMA reflects the prevailing market trend. When the EMA remains above the VWAP, the indicator highlights bullish conditions with blue tones. When it moves below, bearish momentum is displayed with orange tones.
Features
Adjustable VWAP anchor timeframe (Daily, Weekly, or Monthly)
Smoothed VWAP for reduced noise and improved accuracy
Dynamic EMA overlay for real-time trend detection
Color-coded shading between price and VWAP
Minimalist design ideal for clean chart analysis
How to Use
Select your preferred VWAP anchor timeframe.
Observe how the shading color shifts between blue (bullish) and orange (bearish).
Use these transitions to gauge market bias, confirm trade setups, or identify potential mean reversion zones.
Mã nguồn mở
Theo đúng tinh thần TradingView, người tạo ra tập lệnh này đã biến tập lệnh thành mã nguồn mở để các nhà giao dịch có thể xem xét và xác minh công năng. Xin dành lời khen tặng cho tác giả! Mặc dù bạn có thể sử dụng miễn phí, nhưng lưu ý nếu đăng lại mã, bạn phải tuân theo Quy tắc nội bộ của chúng tôi.
Thông báo miễn trừ trách nhiệm
Thông tin và ấn phẩm không có nghĩa là và không cấu thành, tài chính, đầu tư, kinh doanh, hoặc các loại lời khuyên hoặc khuyến nghị khác được cung cấp hoặc xác nhận bởi TradingView. Đọc thêm trong Điều khoản sử dụng.