OPEN-SOURCE SCRIPT
Horizontal Grid from Base Price
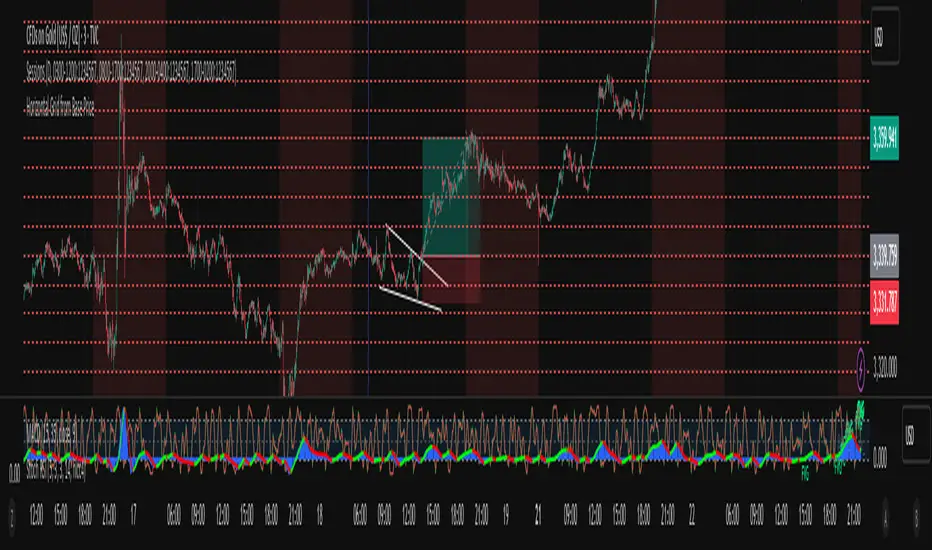
Support & Resistance Indicator function
This inductor is designed to analyze the "resistance line" according to the principle of mother fish technique, with the main purpose of:
• Measure the price swing cycle (Price Swing Cycle)
• analyze the standings of a candle to catch the tempo of the trade
• Used as a decision sponsor in conjunction with Price Action and key zones.
⸻
🛠️ Main features
1. Create Automatic Resistance Boundary
• Based on the open price level of the Day (Initial Session Open) bar.
• It's the main reference point for building a price framework.
2. Set the distance around the resistance line.
• like 100 dots/200 dots/custom
• Provides systematic price tracking (Cycle).
3. Number of lines can be set.
• For example, show 3 lines or more of the top-bottom lines as needed.
4. Customize the color and style of the line.
• The line color can be changed, the line will be in dotted line format according to the user's style.
• Day/night support (Dark/Light Theme)
5. Support for use in conjunction with mother fish techniques.
• Use the line as a base to observe whether the "candle stand above or below the line".
• It is used to help see the behavior of "standing", "loosing", or "flow" of prices on the defensive/resistance line.
6. The default is available immediately.
• The default is based on the current Day bar opening price.
• Round distance, e.g. 200 points, top and bottom, with 3 levels of performance
Mã nguồn mở
Theo đúng tinh thần TradingView, tác giả của tập lệnh này đã công bố nó dưới dạng mã nguồn mở, để các nhà giao dịch có thể xem xét và xác minh chức năng. Chúc mừng tác giả! Mặc dù bạn có thể sử dụng miễn phí, hãy nhớ rằng việc công bố lại mã phải tuân theo Nội quy.
Thông báo miễn trừ trách nhiệm
Thông tin và các ấn phẩm này không nhằm mục đích, và không cấu thành, lời khuyên hoặc khuyến nghị về tài chính, đầu tư, giao dịch hay các loại khác do TradingView cung cấp hoặc xác nhận. Đọc thêm tại Điều khoản Sử dụng.