OPEN-SOURCE SCRIPT
Closest Candle to EMA (CCE)
🔍 Closest Candle to EMA (CCE)
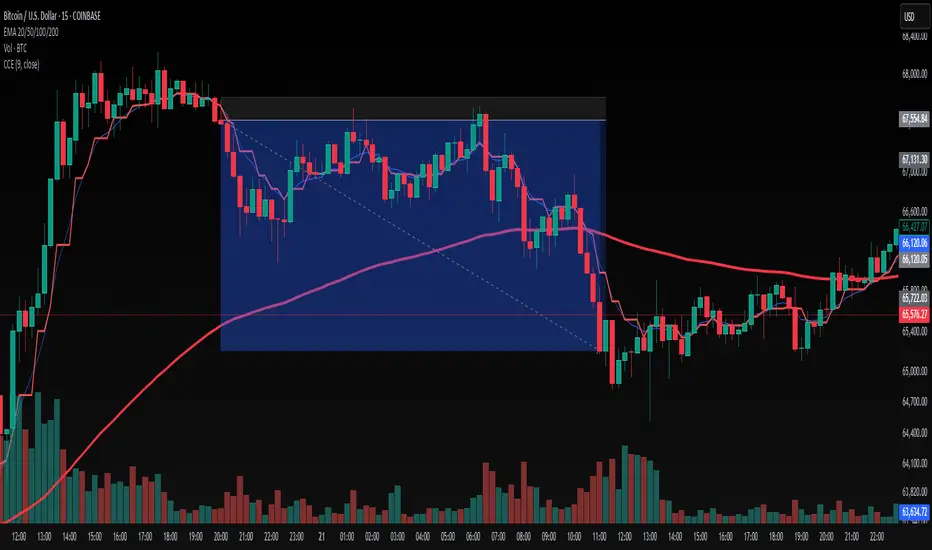
The Closest Candle to EMA (CCE) indicator is a visual analytical tool designed to identify the historical price (candle close) that is closest to the current Exponential Moving Average (EMA) over a user-defined period. This allows traders to easily detect how price has interacted with the trend line recently, providing insights into potential mean reversion, support/resistance, and price convergence behavior.
📌 Key Features
✅ Highlights the candle with a closing price closest to the current EMA
✅ Customizable EMA length for various trading styles and timeframes
✅ Helps detect potential zones of trend interaction
✅ Supports analysis of price behavior near dynamic support/resistance
✅ Lightweight and non-intrusive visual overlay (red = closest price, blue = EMA)
🧠 How It Works
The script calculates the EMA using the user-defined length (default: 20).
It then scans the last N candles (equal to the EMA length) and finds the one whose closing price is closest to the current EMA value.
That close is highlighted in red, while the EMA is shown in blue.
This comparison helps traders understand the proximity of past price action to the current trend level.
💡 Use Cases
Mean Reversion Strategies – Spot when price historically reverts to the trend
Dynamic Support/Resistance Identification – Find levels where price respected or returned to the EMA
Consolidation Zone Analysis – Identify areas where price hovered around trend lines
Backtesting Trend Sensitivity – See how price reacted to EMA over time
⚙️ Settings
EMA Length – Set the number of periods used for EMA and comparison window (default: 20)
📊 Example Strategy Setup – EMA Touch with Reversal Candle
This indicator can be incorporated into a price-action strategy that combines candlestick patterns, EMA proximity, and volume confirmation. Here's a practical use case:
🔧 Note: This setup is designed specifically with the EMA length set to 9.
🔁 Bullish Setup – Hammer + EMA (in uptrend)
The market is in an uptrend, confirmed by EMA(9) sloping upward
A Hammer candlestick forms
The EMA (blue) must touch the lower shadow (wick) of the Hammer
It must not touch the candle body
Candle volume is above average
→ ✅ This may signal a bullish continuation opportunity
🔁 Bearish Setup – Shooting Star + EMA (in downtrend)
The market is in a downtrend, confirmed by EMA(9) sloping downward
A Shooting Star candlestick forms
The EMA (blue) must touch the upper shadow (wick) of the candle
It must not touch the candle body
Candle volume is above average
Mã nguồn mở
Theo đúng tinh thần TradingView, tác giả của tập lệnh này đã công bố nó dưới dạng mã nguồn mở, để các nhà giao dịch có thể xem xét và xác minh chức năng. Chúc mừng tác giả! Mặc dù bạn có thể sử dụng miễn phí, hãy nhớ rằng việc công bố lại mã phải tuân theo Nội quy.
Thông báo miễn trừ trách nhiệm
Thông tin và các ấn phẩm này không nhằm mục đích, và không cấu thành, lời khuyên hoặc khuyến nghị về tài chính, đầu tư, giao dịch hay các loại khác do TradingView cung cấp hoặc xác nhận. Đọc thêm tại Điều khoản Sử dụng.