PROTECTED SOURCE SCRIPT
Multi-Time Period Charts YSTC
The script is available (for free) to YSTC's Course members of "Trading with PAV".
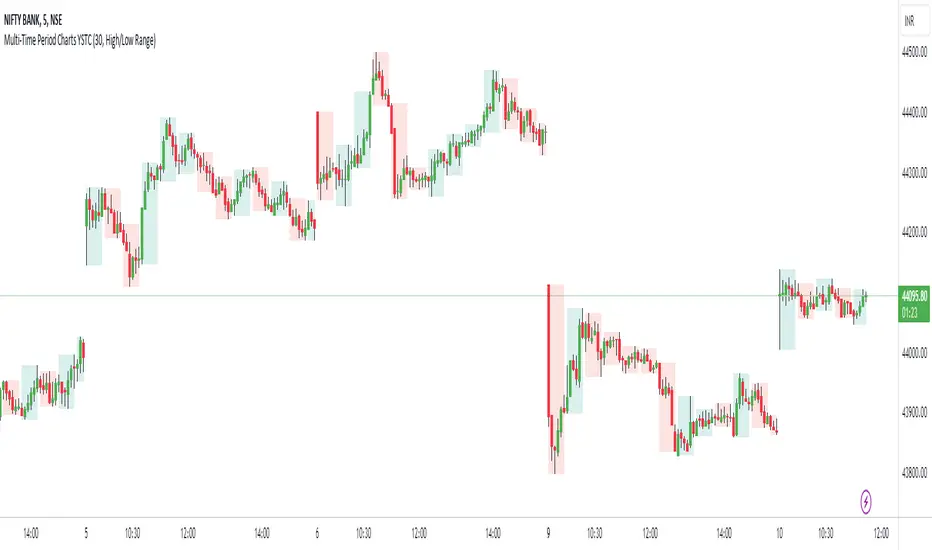
Multi-Time Period Charts lets you see more time frames on one chart.
Open 5 min Chart and turn off AutoTimeFrame and apply 15 min in indicator settings.

As you can see in the above image you can see 15 min candle on 5 min chart.
Below are some of the settings explained.
AutoTimeFrame
When the Auto option is selected, the timeframe of the indicator is chosen automatically based on the chart timeframe. The Timeframe dropdown is ignored. The automated timeframes are:
Calculation
You can add this script to your chart by clicking "Add to favorite indicators" below.
Have Questions ?
contact@ystc.in
Free Stock Market Introduction Available.
Name: Yogesh Patil (YS Trading Coach).
Contact: +91 9637070868.
Time: Monday to Friday (10:00 AM - 07:00 PM).
Multi-Time Period Charts lets you see more time frames on one chart.
Open 5 min Chart and turn off AutoTimeFrame and apply 15 min in indicator settings.
As you can see in the above image you can see 15 min candle on 5 min chart.
Below are some of the settings explained.
AutoTimeFrame
When the Auto option is selected, the timeframe of the indicator is chosen automatically based on the chart timeframe. The Timeframe dropdown is ignored. The automated timeframes are:
- 1 day for any chart timeframes below 1 day
- 1 week for any timeframes starting from 1 day up to 1 week
- 1 month for any timeframes starting from 1 week up to 1 month
- 3 months for any timeframes starting from 1 month up to 3 months
- 12 months for any timeframes above 3 months
Calculation
- True Range (calculates the close price of the previous period)
- High/Low Range (calculates the high and low for the chosen period)
- Heikin Ashi Range (calculates the Heikin Ashi High and Heikin Ashi Low for the chosen period).
- Can toggle the color and visibility of the up/down candles and their borders (Borders already disabled by turning opacity to 0).
You can add this script to your chart by clicking "Add to favorite indicators" below.
Have Questions ?
contact@ystc.in
Free Stock Market Introduction Available.
Name: Yogesh Patil (YS Trading Coach).
Contact: +91 9637070868.
Time: Monday to Friday (10:00 AM - 07:00 PM).
Mã được bảo vệ
Tập lệnh này được đăng dưới dạng mã nguồn đóng. Tuy nhiên, bạn có thể sử dụng tự do và không giới hạn – tìm hiểu thêm tại đây.
Thông báo miễn trừ trách nhiệm
Thông tin và các ấn phẩm này không nhằm mục đích, và không cấu thành, lời khuyên hoặc khuyến nghị về tài chính, đầu tư, giao dịch hay các loại khác do TradingView cung cấp hoặc xác nhận. Đọc thêm tại Điều khoản Sử dụng.