PROTECTED SOURCE SCRIPT
Square Lines Around customized font_RAMLAKSHMANDAS
Square Lines Around customized font_RAMLAKSHMANDAS
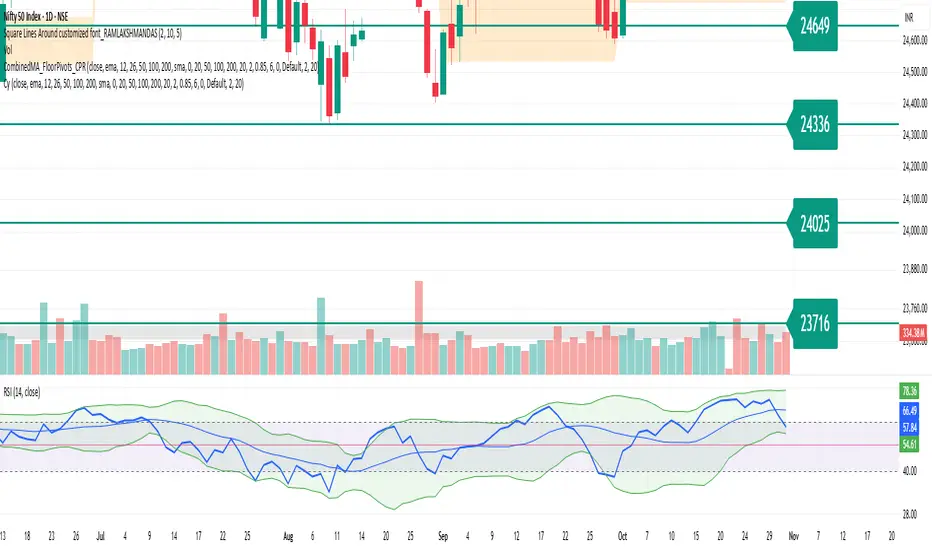
This indicator draws dynamic horizontal lines at all integer squares around the square root of the current close price, helping traders visualize price levels with mathematical significance. Each line is labeled, and the level font size can be customized interactively through a simple “Text Size (1-5)” input, making it easy to adapt for different chart sizes or visibility needs.
Features:
Plots horizontal lines at every perfect square (i.e.,
i
2
i
2
) near the rounded square root of close price.
Displays level values as labels, with user-adjustable font size (select 1 to 5, mapped to tiny up to huge).
All lines and labels (levels) are automatically updated with each new candle.
User controls for line color, line width, level range, and label font size.
Fully compatible with all TradingView intervals and symbols.
Usage:
Helps spot mathematically relevant support/resistance zones for custom strategies.
Useful for visual traders, quant experimenters, and anyone interested in market geometry.
Best suited for intraday, positional or backtest analysis where precise price levels matter.
Customizations:
Range +/- around square root (choose how many lines you want).
Line color and thickness for clarity.
Select label font size: 1 (tiny), 2 (small), 3 (normal), 4 (large), 5 (huge).
How to use:
Add to your chart, tweak settings in the input panel, and see instant updates.
Labels are sized to your preference for maximum visibility.
Mã được bảo vệ
Tập lệnh này được đăng dưới dạng mã nguồn đóng. Tuy nhiên, bạn có thể sử dụng tự do và không giới hạn – tìm hiểu thêm tại đây.
Thông báo miễn trừ trách nhiệm
Thông tin và các ấn phẩm này không nhằm mục đích, và không cấu thành, lời khuyên hoặc khuyến nghị về tài chính, đầu tư, giao dịch hay các loại khác do TradingView cung cấp hoặc xác nhận. Đọc thêm tại Điều khoản Sử dụng.