OPEN-SOURCE SCRIPT
Cập nhật MOEX Sectors: % Above MA 50/100/200 (EMA/SMA)
🧠 Name:
MOEX Sectors: % Above MA 50/100/200 (EMA/SMA)
📋 Description (for TradingView “Description” tab):
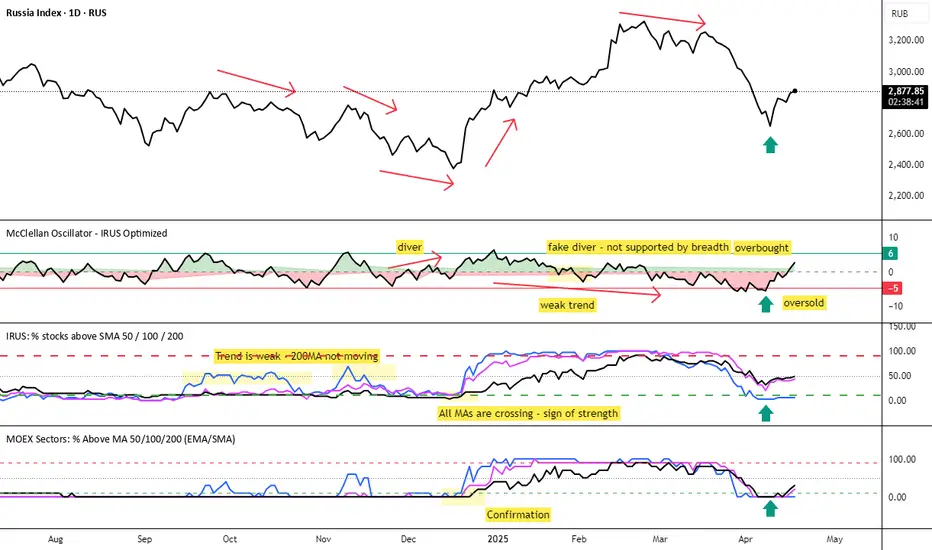
This indicator shows the percentage of Moscow Exchange sectoral indices trading above the selected moving average (SMA or EMA) with periods of 50, 100, or 200.
It uses 10 official MOEX sector indices:
MOEXOG (Oil & Gas)
MOEXCH (Chemicals)
MOEXMM (Metals & Mining)
MOEXTN (Transport)
MOEXCN (Consumer)
MOEXFN (Financials)
MOEXTL (Telecom)
MOEXEU (Utilities)
MOEXIT (IT)
MOEXRE (Real Estate)
The indicator plots up to 3 lines representing the % of sectors trading above MA 50, 100, and/or 200. The MA type is user-selectable: EMA (default) or SMA.
Horizontal reference levels (90, 50, 10) help interpret market conditions:
🔼 >90% — Overbought zone, potential market exhaustion
⚖️ ~50% — Neutral state
🔽 <10% — Oversold zone, possible rebound
📈 How to Use in Strategy:
✅ 1. Trend Filter
If >50% of sectors are above MA 200 → market in long-term uptrend
If <50% → avoid long bias, bearish regime likely
✅ 2. Bottom Detection
When <10% of sectors are above MA 200, the market is heavily oversold — often a bottoming signal
✅ 3. Trend Confirmation
If the main index is rising and % of sectors above MA is growing, the trend is supported by breadth
If the index rises while breadth declines → bearish divergence
✅ 4. Contrarian Setups
>90% of sectors above MA 50 → market may be overheated, watch for pullback
<20% above MA 50 → potential local bottom
⚙️ Tips:
Overlay this indicator on the IMOEX index chart to detect narrow leadership
Combine with other breadth metrics or RSI on the index
Use the EMA/SMA toggle to fine-tune sensitivity
MOEX Sectors: % Above MA 50/100/200 (EMA/SMA)
📋 Description (for TradingView “Description” tab):
This indicator shows the percentage of Moscow Exchange sectoral indices trading above the selected moving average (SMA or EMA) with periods of 50, 100, or 200.
It uses 10 official MOEX sector indices:
MOEXOG (Oil & Gas)
MOEXCH (Chemicals)
MOEXMM (Metals & Mining)
MOEXTN (Transport)
MOEXCN (Consumer)
MOEXFN (Financials)
MOEXTL (Telecom)
MOEXEU (Utilities)
MOEXIT (IT)
MOEXRE (Real Estate)
The indicator plots up to 3 lines representing the % of sectors trading above MA 50, 100, and/or 200. The MA type is user-selectable: EMA (default) or SMA.
Horizontal reference levels (90, 50, 10) help interpret market conditions:
🔼 >90% — Overbought zone, potential market exhaustion
⚖️ ~50% — Neutral state
🔽 <10% — Oversold zone, possible rebound
📈 How to Use in Strategy:
✅ 1. Trend Filter
If >50% of sectors are above MA 200 → market in long-term uptrend
If <50% → avoid long bias, bearish regime likely
✅ 2. Bottom Detection
When <10% of sectors are above MA 200, the market is heavily oversold — often a bottoming signal
✅ 3. Trend Confirmation
If the main index is rising and % of sectors above MA is growing, the trend is supported by breadth
If the index rises while breadth declines → bearish divergence
✅ 4. Contrarian Setups
>90% of sectors above MA 50 → market may be overheated, watch for pullback
<20% above MA 50 → potential local bottom
⚙️ Tips:
Overlay this indicator on the IMOEX index chart to detect narrow leadership
Combine with other breadth metrics or RSI on the index
Use the EMA/SMA toggle to fine-tune sensitivity
Phát hành các Ghi chú
📝 This indicator tracks market breadth across sector indices of the Moscow Exchange (MOEX). It calculates the percentage of sectors trading above selected moving averages (SMA or EMA) with user-defined periods (50, 100, or 200).It provides a high-level view of market participation and internal strength, helping to identify broad trends, divergences, and potential reversals.
📦 Tracked MOEX Sector Indices:
mathematica
Copy
Edit
MOEXOG — Oil & Gas
MOEXCH — Chemicals
MOEXMM — Metals & Mining
MOEXTN — Transport
MOEXCN — Consumer
MOEXFN — Financials
MOEXTL — Telecom
MOEXEU — Utilities
MOEXIT — Information Technology
MOEXRE — Real Estate
📈 How to Use:
>50% above MA 200 → Bullish market regime
<50% above MA 200 → Weak breadth, caution advised
>90% above MA 50 → Market may be overbought
<10% above MA 200 → Market oversold, possible bottom
Combine with the IMOEX index to assess participation behind major moves
Use as a trend filter or divergence detector
Mã nguồn mở
Theo đúng tinh thần TradingView, tác giả của tập lệnh này đã công bố nó dưới dạng mã nguồn mở, để các nhà giao dịch có thể xem xét và xác minh chức năng. Chúc mừng tác giả! Mặc dù bạn có thể sử dụng miễn phí, hãy nhớ rằng việc công bố lại mã phải tuân theo Nội quy.
Thông báo miễn trừ trách nhiệm
Thông tin và các ấn phẩm này không nhằm mục đích, và không cấu thành, lời khuyên hoặc khuyến nghị về tài chính, đầu tư, giao dịch hay các loại khác do TradingView cung cấp hoặc xác nhận. Đọc thêm tại Điều khoản Sử dụng.