OPEN-SOURCE SCRIPT
Cập nhật Triple Kijun Trend by Spiralman
Ispired from "Oscars Simple Trend Ichimoku Kijun-sen" by CapnOscar
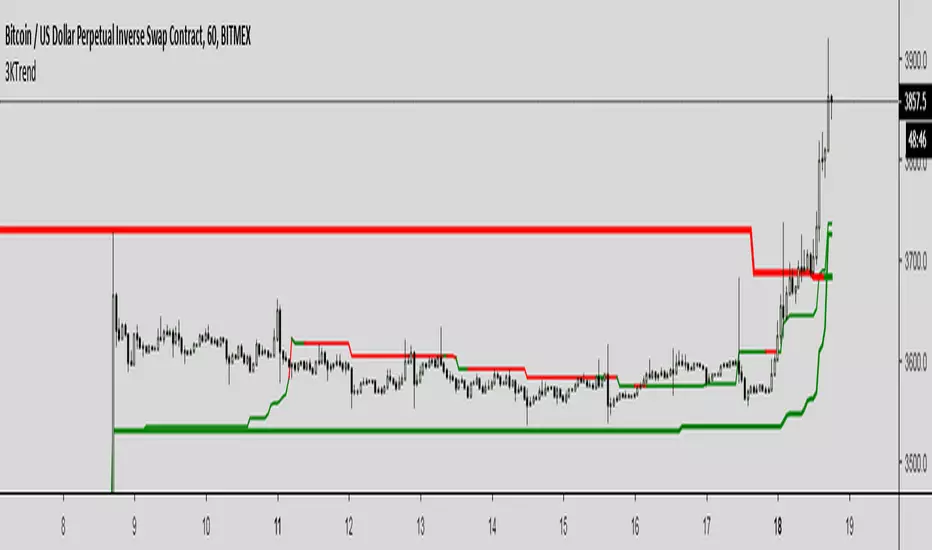
Script displays 3 kijun lines: one for current TF, second one emulates it for TF 4 times higher, third one for x16.
For example on 1H chart there will be 3 kijuns: one for 1H, second one for 4H (emulated), third one for 16H (emulated).
Kijuns change colors based on their position relative to price.
Kijun Sen
The base line, the slower EMA derivative, and a dynamic representation of the mean. With that said, the Kijun serves as both critical support and resistance levels for price. How does it work, and why would the Kijun be superior to commonly used moving average indicators? Fun fact: The Kijun dynamically equalizes itself to be the 50% retracement (or 0.5 Fibonacci level) of price for any given swing, and price will ALWAYS gravitate to the Kijun at some point regardless of how far above or below it is from it. By taking the median of price extremes, the Kijun accounts for volatility that other MAs or EMAs do not. A flat horizontal Kijun means that price extremes have not changed, and that the current trend losing momentum. Crypto-adjusted calculation: (highest high + lowest low) / 2 calculated over the last 60 periods.
Phát hành các Ghi chú
1. Added option of assigning Tenkan length divider for usual trigger method
2. Added option to choose Tenkan-Sen as a trigger on corresponding TK crosses which could lead to unexpected color changes though
Phát hành các Ghi chú
Added option for choosing custom TF multipliers for 2nd and 3rd Kijun lines.Mã nguồn mở
Theo đúng tinh thần TradingView, người tạo ra tập lệnh này đã biến tập lệnh thành mã nguồn mở để các nhà giao dịch có thể xem xét và xác minh công năng. Xin dành lời khen tặng cho tác giả! Mặc dù bạn có thể sử dụng miễn phí, nhưng lưu ý nếu đăng lại mã, bạn phải tuân theo Quy tắc nội bộ của chúng tôi.
Thông báo miễn trừ trách nhiệm
Thông tin và ấn phẩm không có nghĩa là và không cấu thành, tài chính, đầu tư, kinh doanh, hoặc các loại lời khuyên hoặc khuyến nghị khác được cung cấp hoặc xác nhận bởi TradingView. Đọc thêm trong Điều khoản sử dụng.
Mã nguồn mở
Theo đúng tinh thần TradingView, người tạo ra tập lệnh này đã biến tập lệnh thành mã nguồn mở để các nhà giao dịch có thể xem xét và xác minh công năng. Xin dành lời khen tặng cho tác giả! Mặc dù bạn có thể sử dụng miễn phí, nhưng lưu ý nếu đăng lại mã, bạn phải tuân theo Quy tắc nội bộ của chúng tôi.
Thông báo miễn trừ trách nhiệm
Thông tin và ấn phẩm không có nghĩa là và không cấu thành, tài chính, đầu tư, kinh doanh, hoặc các loại lời khuyên hoặc khuyến nghị khác được cung cấp hoặc xác nhận bởi TradingView. Đọc thêm trong Điều khoản sử dụng.