PROTECTED SOURCE SCRIPT
Cập nhật Sangana beta table
Ideal to use this indicator in Monthly timeframe.
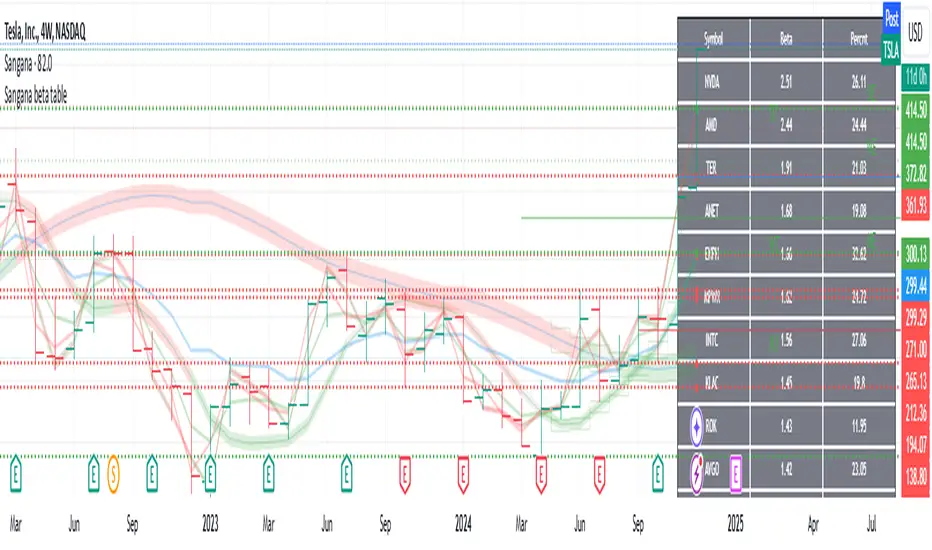
This indicator shows three values on a table.
First column is stocks list from a particular sector(sector selection from settings)
Second column is beta of stock. Beta can be used to check how correlated(multiplied by how volatile) the stock is with respect to market S&P500 or Nifty500.
Third column is average percentage of a stock price movement in a month from low price to high price. This is just calculated on the price. If one enters at the low of that monthly candle and exits at the high of that monthly candle, they can expect to gain that much percentage on an average that is shown in this column.
How to use this indicator: Bigger returns on a stock is expected if it swings good amount of percentage from low to high on a regular basis. Either short term or long term, investing in the stocks which high average percentage from low to high, yields better returns. However downside also gives bigger losses if stock is going down. Stay in high volatile stocks, if one is sure of upside movement.
Sorting of beta column or percentage column can be chosen on settings. Sorting is always down high to low.
This indicator is tracks stocks in S&P500 or Nifty500.
Phát hành các Ghi chú
Minor bug fix for beta calculation with respect to SPY.Mã được bảo vệ
Tập lệnh này được đăng dưới dạng mã nguồn đóng. Tuy nhiên, bạn có thể sử dụng tự do và không giới hạn – tìm hiểu thêm tại đây.
Thông báo miễn trừ trách nhiệm
Thông tin và các ấn phẩm này không nhằm mục đích, và không cấu thành, lời khuyên hoặc khuyến nghị về tài chính, đầu tư, giao dịch hay các loại khác do TradingView cung cấp hoặc xác nhận. Đọc thêm tại Điều khoản Sử dụng.
Mã được bảo vệ
Tập lệnh này được đăng dưới dạng mã nguồn đóng. Tuy nhiên, bạn có thể sử dụng tự do và không giới hạn – tìm hiểu thêm tại đây.
Thông báo miễn trừ trách nhiệm
Thông tin và các ấn phẩm này không nhằm mục đích, và không cấu thành, lời khuyên hoặc khuyến nghị về tài chính, đầu tư, giao dịch hay các loại khác do TradingView cung cấp hoặc xác nhận. Đọc thêm tại Điều khoản Sử dụng.