OPEN-SOURCE SCRIPT
ACD PMA
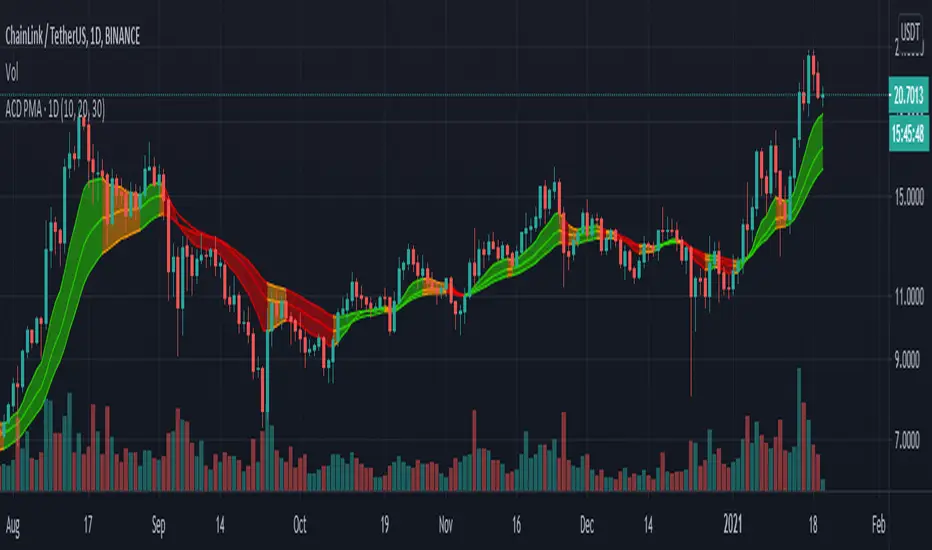
PMA (Pivot Moving average) is a set of 3 EMAs on HLC3 data.
When all PMAs are rising, market is considered bullish and the color of PMA becomes green. When all PMAs are falling, market is considered bearish and the color of the PMA becomes red. Otherwise, market is considered ranging and the color becomes orange.
It's also possible to set the resolution of PMAs. For example, you can see daily PMA of 15min charts. This way, if resolution of PMA is greater than resolution of chart, a vertical line shows the beginning of the PMA's resolution candles.
These PMAs are important components of Mark Fisher's ACD strategy.
Mã nguồn mở
Theo đúng tinh thần TradingView, tác giả của tập lệnh này đã công bố nó dưới dạng mã nguồn mở, để các nhà giao dịch có thể xem xét và xác minh chức năng. Chúc mừng tác giả! Mặc dù bạn có thể sử dụng miễn phí, hãy nhớ rằng việc công bố lại mã phải tuân theo Nội quy.
Thông báo miễn trừ trách nhiệm
Thông tin và các ấn phẩm này không nhằm mục đích, và không cấu thành, lời khuyên hoặc khuyến nghị về tài chính, đầu tư, giao dịch hay các loại khác do TradingView cung cấp hoặc xác nhận. Đọc thêm tại Điều khoản Sử dụng.