PROTECTED SOURCE SCRIPT
VIX (StevenCharts)
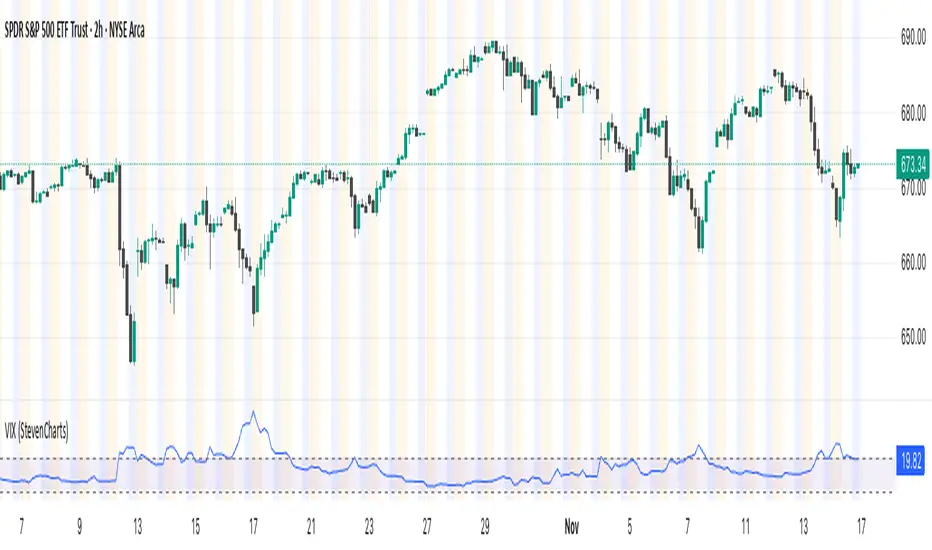
This indicator plots the VIX (CBOE Volatility Index) in a separate pane to help you quickly gauge market sentiment and volatility.
It highlights the key zone between 15 and 20, which often acts as a transition area between low and high-volatility regimes.
Features:
Plots the VIX line.
Allows you to change the color of the VIX line.
It highlights the key zone between 15 and 20, which often acts as a transition area between low and high-volatility regimes.
Features:
Plots the VIX line.
Allows you to change the color of the VIX line.
Mã được bảo vệ
Tập lệnh này được đăng dưới dạng mã nguồn đóng. Tuy nhiên, bạn có thể sử dụng tự do và không giới hạn – tìm hiểu thêm tại đây.
Thông báo miễn trừ trách nhiệm
Thông tin và các ấn phẩm này không nhằm mục đích, và không cấu thành, lời khuyên hoặc khuyến nghị về tài chính, đầu tư, giao dịch hay các loại khác do TradingView cung cấp hoặc xác nhận. Đọc thêm tại Điều khoản Sử dụng.