OPEN-SOURCE SCRIPT
Equity chart [LM]
Hey Guys,
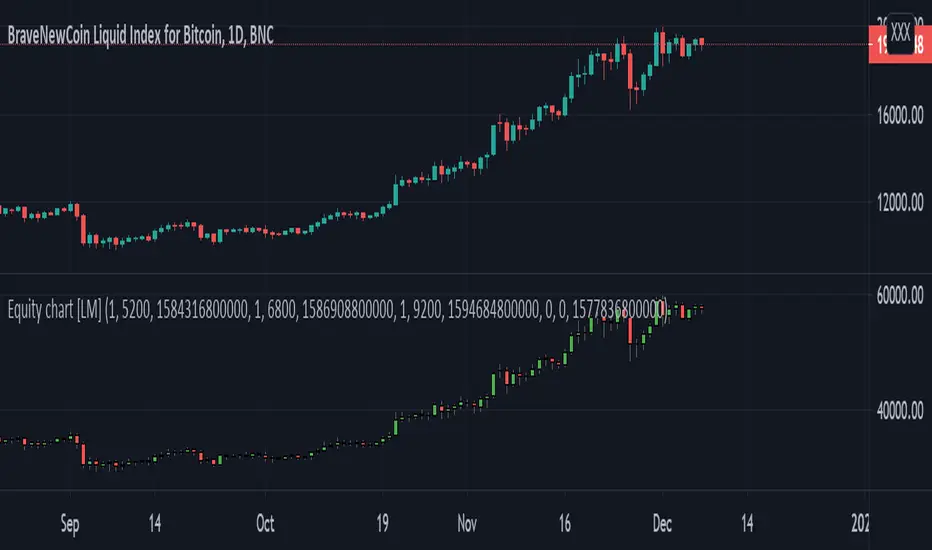
I have created draft version of chart where you can put your position amount and position price and position date for each entry and it will chart your equity as candle stick chart. There are currently possible to include 4 positions but you can add as many you like by modyfing the code.
It will calculate your average entry based on your input and in date where you add other entry it will create gap. I have already plan to include there also leverage on each position. The idea is that you should trade your equity and with this indicator you will be able to create your custom indicator based on equity chart and not price chart.
!! Unless you will enter position nothing will be rendered
Indicator is under breadth indicator because didn't know where to put it.
I release this script for collaboration and improving the idea with new features
Cheers,
Lukas
Mã nguồn mở
Theo đúng tinh thần TradingView, tác giả của tập lệnh này đã công bố nó dưới dạng mã nguồn mở, để các nhà giao dịch có thể xem xét và xác minh chức năng. Chúc mừng tác giả! Mặc dù bạn có thể sử dụng miễn phí, hãy nhớ rằng việc công bố lại mã phải tuân theo Nội quy.
Thông báo miễn trừ trách nhiệm
Thông tin và các ấn phẩm này không nhằm mục đích, và không cấu thành, lời khuyên hoặc khuyến nghị về tài chính, đầu tư, giao dịch hay các loại khác do TradingView cung cấp hoặc xác nhận. Đọc thêm tại Điều khoản Sử dụng.