PROTECTED SOURCE SCRIPT
Cập nhật The Directional Cross Strategy
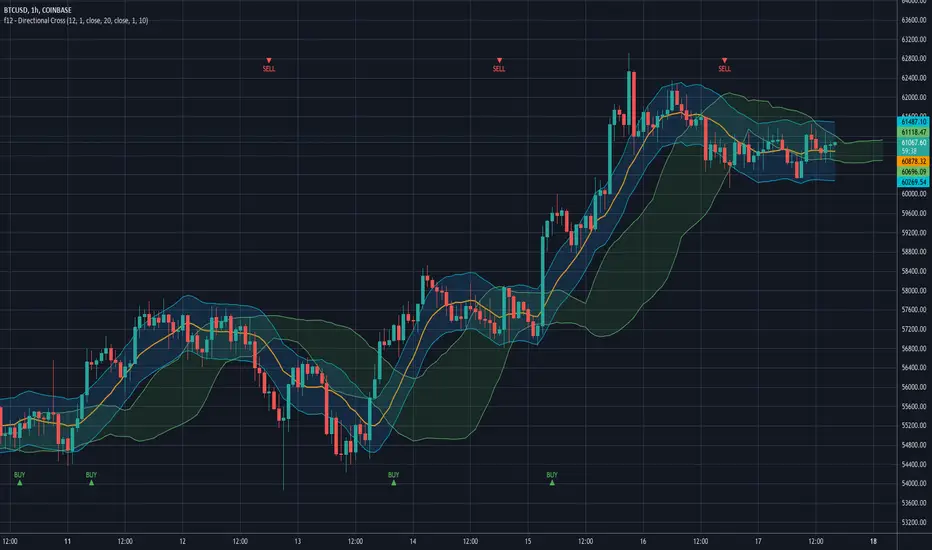
A simple chart-based strategy, which capitalizes on trend change.
Based on Azeez Mustapha's article featured in Stocks & Commodities Oct 2021 issue.
This indicator consists of three tools: a simple moving average (SMA), price envelopes, and Bollinger Bands.
Please note that this strategy only works in trending markets.
What is a trending market?
A trending market is one that is ascending with higher highs and higher lows or descending with lower highs and lower lows.
So, when the market is ranging it's not a good fit for this strategy. It is therefore advisable for the trader to stay out of the market when consolidation is noticed.
Usage of other tools in combination with this one is recommended to determine the market conditions.
Ok, so how to use this indicator:
The combination of the indicators used in this strategy displays BUY and SELL alerts.
When the lower line of the envelope on the chart would cross over the lower band of the Bollinger Bands, a BUY alert is displayed.
When the upper line of the envelope on the chart would cross down the upper band of the Bollinger Bands, a SELL alert is displayed.
As always, proper risk management should be followed.
Phát hành các Ghi chú
Buy/Sell signals now coordinate with the BB offset.Mã được bảo vệ
Tập lệnh này được đăng dưới dạng mã nguồn đóng. Tuy nhiên, bạn có thể sử dụng tự do và không giới hạn – tìm hiểu thêm tại đây.
Thông báo miễn trừ trách nhiệm
Thông tin và các ấn phẩm này không nhằm mục đích, và không cấu thành, lời khuyên hoặc khuyến nghị về tài chính, đầu tư, giao dịch hay các loại khác do TradingView cung cấp hoặc xác nhận. Đọc thêm tại Điều khoản Sử dụng.
Mã được bảo vệ
Tập lệnh này được đăng dưới dạng mã nguồn đóng. Tuy nhiên, bạn có thể sử dụng tự do và không giới hạn – tìm hiểu thêm tại đây.
Thông báo miễn trừ trách nhiệm
Thông tin và các ấn phẩm này không nhằm mục đích, và không cấu thành, lời khuyên hoặc khuyến nghị về tài chính, đầu tư, giao dịch hay các loại khác do TradingView cung cấp hoặc xác nhận. Đọc thêm tại Điều khoản Sử dụng.