PROTECTED SOURCE SCRIPT
Cập nhật BTC Time Cycle
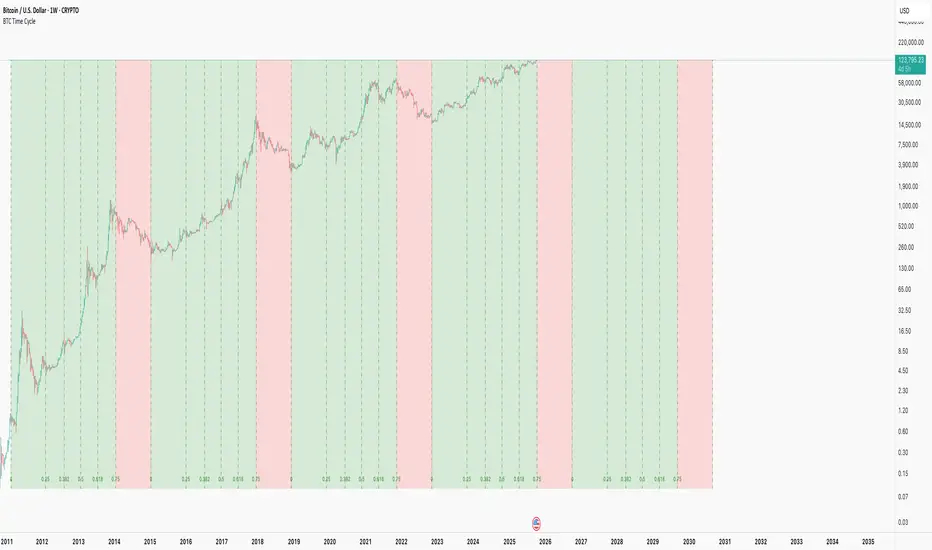
This indicator helps track Bitcoin's historical four-year cycles by dividing time from market bottoms into Fibonacci-based segments, providing clear visual cues for potential bullish and bearish phases.
How It Works: This indicator overlays repeating Fibonacci-based time cycles onto weekly BTC charts, plotting vertical lines at key Fib ratios (0, 0.25, 0.382, 0.5, 0.618, 0.75, 1.0) to track cycle progress. Each cycle concludes at 1.0 and seamlessly resets as the next cycle's 0, capturing historical trough-to-trough intervals like those observed from 2018 to 2022. The week preceding the 0.75 Fibonacci ratio typically signals the cycle peak and bear market onset, transitioning through the final phase until 1.0 initiates a new cycle.
Disclaimer: This pattern has consistently repeated in past cycles, but financial markets are inherently unpredictable—it is not guaranteed to persist and remains valid only until disproven. Treat it as an analytical aid, not a predictive certainty.
This is merely a curiosity and is: True until it isn't™
Phát hành các Ghi chú
This indicator helps track Bitcoin's historical four-year cycles by dividing time from market bottoms into Fibonacci-based segments, providing clear visual cues for potential bullish and bearish phases.How It Works: This indicator overlays repeating Fibonacci-based time cycles onto weekly BTC charts, plotting vertical lines at key Fib ratios (0, 0.25, 0.382, 0.5, 0.618, 0.75, 1.0) to track cycle progress. Each cycle concludes at 1.0 and seamlessly resets as the next cycle's 0, capturing historical trough-to-trough intervals like those observed from 2018 to 2022. The week preceding the 0.75 Fibonacci ratio typically signals the cycle peak and bear market onset, transitioning through the final phase until 1.0 initiates a new cycle.
Disclaimer: This pattern has consistently repeated in past cycles, but financial markets are inherently unpredictable—it is not guaranteed to persist and remains valid only until disproven. Treat it as an analytical aid, not a predictive certainty.
This is merely a curiosity and is: True until it isn't™
Mã được bảo vệ
Tập lệnh này được đăng dưới dạng mã nguồn đóng. Tuy nhiên, bạn có thể sử dụng tự do và không giới hạn – tìm hiểu thêm tại đây.
Thông báo miễn trừ trách nhiệm
Thông tin và các ấn phẩm này không nhằm mục đích, và không cấu thành, lời khuyên hoặc khuyến nghị về tài chính, đầu tư, giao dịch hay các loại khác do TradingView cung cấp hoặc xác nhận. Đọc thêm tại Điều khoản Sử dụng.