OPEN-SOURCE SCRIPT
Cập nhật High Volume Price Levels x3
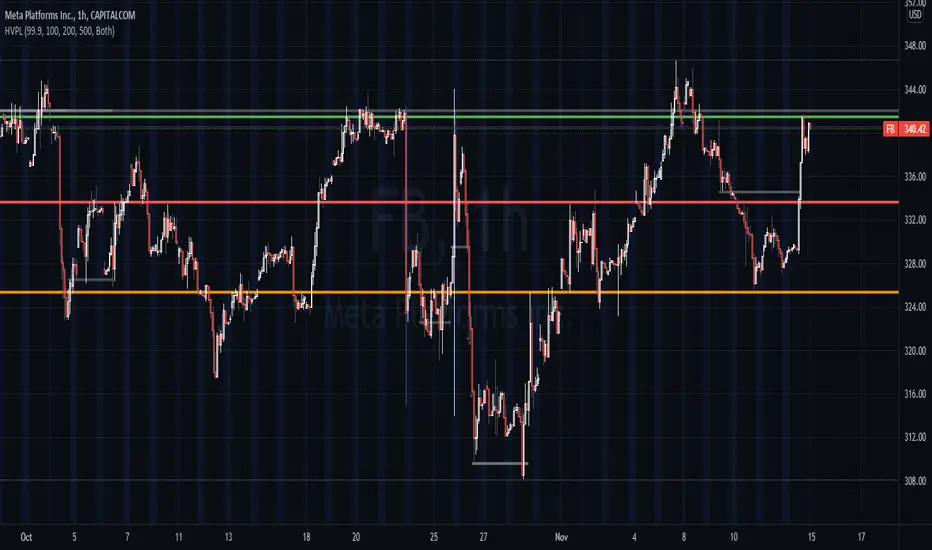
This script detects recent huge volume areas to help you finding out good support and resistance levels.
For each of the3 periods (defaults : 100, 200, 500) a new line will be drawn from the last time the volume amount exceeded n% (default 99%) of the highest volume on the same period, to the next occurence.
Most of time, these lines represent strong support and resistance levels which can be helpful in your technical analysis.
Options:
Notes:
* Sometimes, the last detected level from every periods can be the same at the same moment. In this situation, you'll only see one or two of the lines instead of three.
* I'd like to figure out how to continuously draw every interesting levels without making the chart unreadable. Of course this script will be updated if I find a good way to do it.
* Feel free to suggest any improvements/modifications.
Example:

For each of the3 periods (defaults : 100, 200, 500) a new line will be drawn from the last time the volume amount exceeded n% (default 99%) of the highest volume on the same period, to the next occurence.
Most of time, these lines represent strong support and resistance levels which can be helpful in your technical analysis.
Options:
- Volume trigger level: represents the minimum % of the highest volume within the given period on which you want to draw a new price level. (But higher this % is, stronger the levels will be)
- Periods: The reference periods for high volume detection.
- Show period: Enable/Disable the use of any period.
- Period Color: Select a color correspondig to each period.
- Show current levels only: Disable drawing of previous levels, to display current levels only.
- Extend last level: Extend current lines to right/left/both or none sides of your chart.
Notes:
* Sometimes, the last detected level from every periods can be the same at the same moment. In this situation, you'll only see one or two of the lines instead of three.
* I'd like to figure out how to continuously draw every interesting levels without making the chart unreadable. Of course this script will be updated if I find a good way to do it.
* Feel free to suggest any improvements/modifications.
Example:
Phát hành các Ghi chú
Demo chart updated. Previous levels drawnPhát hành các Ghi chú
- Corrected mistyped short title
- A "Ghost lines" option that extend 3rd period price lines has been added (activated by default)
- Previous levels are now colored in gray
Phát hành các Ghi chú
Fix wrong operator in the previous update 1min (ago)Phát hành các Ghi chú
fix: old lines corresponding to 3rd price level still in red instead of gray when ghost lines are disabledPhát hành các Ghi chú
fix: tiny display bug for period1 linefix: removing useless empty lines
fix: any line width is now fixed to 3
Mã nguồn mở
Theo đúng tinh thần TradingView, tác giả của tập lệnh này đã công bố nó dưới dạng mã nguồn mở, để các nhà giao dịch có thể xem xét và xác minh chức năng. Chúc mừng tác giả! Mặc dù bạn có thể sử dụng miễn phí, hãy nhớ rằng việc công bố lại mã phải tuân theo Nội quy.
Thông báo miễn trừ trách nhiệm
Thông tin và các ấn phẩm này không nhằm mục đích, và không cấu thành, lời khuyên hoặc khuyến nghị về tài chính, đầu tư, giao dịch hay các loại khác do TradingView cung cấp hoặc xác nhận. Đọc thêm tại Điều khoản Sử dụng.