OPEN-SOURCE SCRIPT
Cập nhật Volume Variation Index Indicator
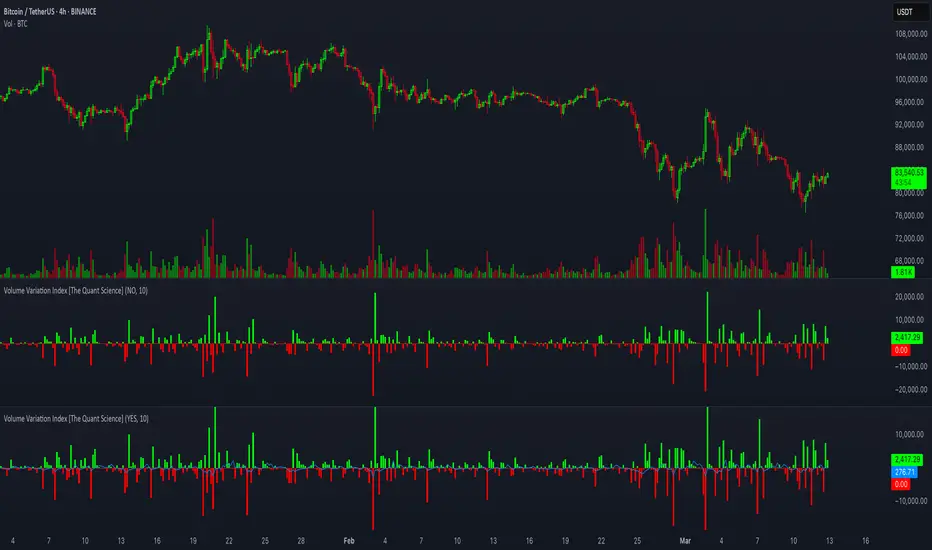
This tool is a quantitative tip for analysts who study volumes or create volume based trading strategies.
Like all our projects, we start with a statistical logic to which we add coding logic.
This indicator can save a huge amount of time in calculating the variation of volume between sessions.
How it work
The indicator calculates the difference between the volume of the last closing bar and the volume of the previous closing bar. It shows the difference between the trading volumes.
The session in which the trading volume is up are represented in green.
Red session represent trading volume down.
We have added a third function.
Through the User Interface the trader can activate or deactivate the variation average.
The indicator is able to calculate the average of the volume changes by representing it with a blue line.
To activate the average, simply set it to ON in the User Interface.
By default, the indicator calculates the average of the last 10 periods, but you are free to set this parameter in the User Interface.
Data access
To access the data, simply move the cursor. When you move the cursor over the green bars, the increase data will be displayed in green. By hovering the cursor over the red bars you will see the decrease data in red. By hovering the cursor over the average will show you the average data in blue.
The data is displayed in the top left corner of the indicator dashboard.
If you found this indicator helpful, please like our script.
Phát hành các Ghi chú
This tool is a quantitative tip for analysts who study volumes or create volume based trading strategies, calculating the variation of volume between bars.How it work
The indicator calculates the difference between the volume of the last closing bar and the volume of the previous closing bar. It shows the difference between the trading volumes.
When trading volume is up bars are represented in green.
When trading volume is down bars are represented in red.
Extra Function
Through the User Interface the user can activate or deactivate the variation average.
The indicator is able to calculate the average of the volume changes by representing it with a blue line. To activate the average, simply set it 'ON' in the User Interface. By default, the indicator calculates the average of the last 10 periods, but you are free to change this parameter.
Data access
To access the data, simply move the cursor. When you move the cursor over the green bars, the increase data will be displayed in green. By hovering the cursor over the red bars you will see the decrease data in red. By hovering the cursor over the average will show you the average data in blue. The data is displayed in the top left corner of the indicator dashboard.
If you found this indicator helpful, please like our script.
Code update to Pine Script V6
Mã nguồn mở
Theo đúng tinh thần TradingView, tác giả của tập lệnh này đã công bố nó dưới dạng mã nguồn mở, để các nhà giao dịch có thể xem xét và xác minh chức năng. Chúc mừng tác giả! Mặc dù bạn có thể sử dụng miễn phí, hãy nhớ rằng việc công bố lại mã phải tuân theo Nội quy.
Thông báo miễn trừ trách nhiệm
Thông tin và các ấn phẩm này không nhằm mục đích, và không cấu thành, lời khuyên hoặc khuyến nghị về tài chính, đầu tư, giao dịch hay các loại khác do TradingView cung cấp hoặc xác nhận. Đọc thêm tại Điều khoản Sử dụng.