OPEN-SOURCE SCRIPT
EMA-BAND-PIVOT-VCP
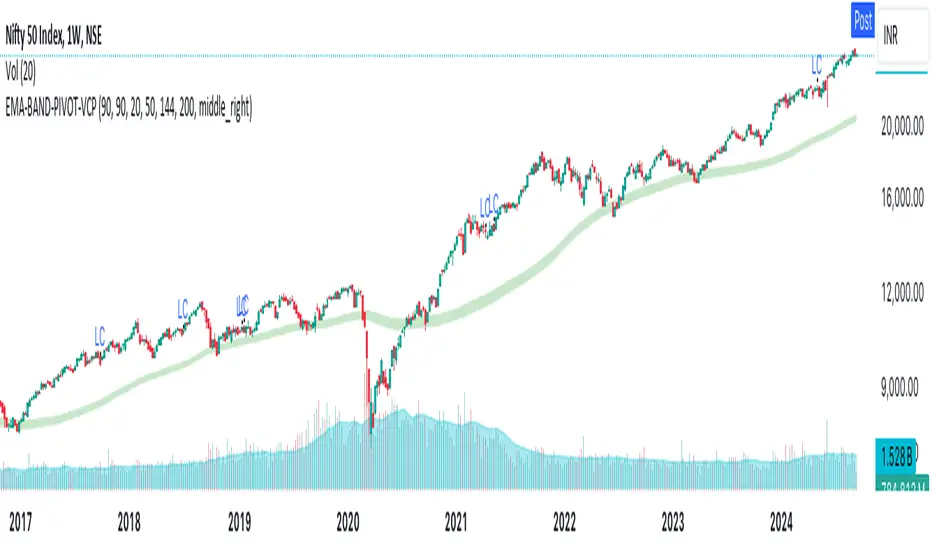
This indicator is named "EMA-BAND-PIVOT-VCP" and integrates multiple elements such as moving averages, volume, volatility contraction patterns (VCP), pivot points, and a table to display key market metrics.
Key Features:
Moving Averages: ( 4 - EMA) default settings 20 , 50 ,144 , 200 . Can be changed in settings.
Pivot Highs and Lows:
The script detects pivot highs and pivot lows using customizable left and right lengths and plots labels to mark these points on the chart.
TIG BAND : This is setting of 2 sma - with the high and low of 90 day average which forms like a band . Its a very strong indicator of trend . Buying is suggestable above this .This has to be tested on your own to knowhow it works wonders ( price magnet). Works on all timeframes . (credit : Bhushan Sir from TIG ) .These are the best buy areas.
Volatility Contraction :
It identifies specific price contraction pattern .
vc marked - used 4 candles - first candle is the mother bar ., 2,3 and 4th candles complete range ( high to low ) is within the range of mother candle.
lc marked -here the closing is considered not the wicks. used 8 candles., the 7 candles closing is within the range of motherbar. Crosses are plotted on the last candle
Table Display:
A table is displayed on the chart with data such as EMA values, relative volume (RVol), Average Daily Range (ADR), and volume ratios. This gives a comprehensive overview of current market conditions.(RVol) compared to the 50-period volume SMA, percentage volume change, and other metrics is also displayed.
Mã nguồn mở
Theo đúng tinh thần TradingView, tác giả của tập lệnh này đã công bố nó dưới dạng mã nguồn mở, để các nhà giao dịch có thể xem xét và xác minh chức năng. Chúc mừng tác giả! Mặc dù bạn có thể sử dụng miễn phí, hãy nhớ rằng việc công bố lại mã phải tuân theo Nội quy.
Thông báo miễn trừ trách nhiệm
Thông tin và các ấn phẩm này không nhằm mục đích, và không cấu thành, lời khuyên hoặc khuyến nghị về tài chính, đầu tư, giao dịch hay các loại khác do TradingView cung cấp hoặc xác nhận. Đọc thêm tại Điều khoản Sử dụng.