OPEN-SOURCE SCRIPT
Cập nhật Regression Line (Log)
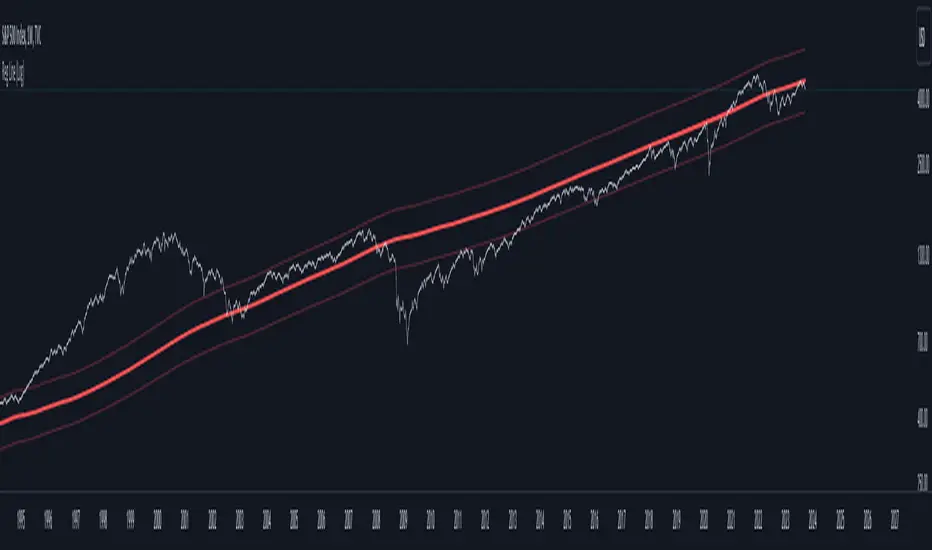
This indicator is based on the "Linear Regression Channel (Log)," which, in turn, is derived from TradingView's "Linear Regression Channel."
The "Regression Line (Log)" indicator is a valuable tool for traders and investors seeking to gain insights into long-term market trends. This indicator is personally favored for its ability to provide a comprehensive view of price movements over extended periods. It offers a unique perspective compared to traditional linear regression lines and moving averages, making it a valuable addition to the toolkit of experienced traders and investors.
Indicator Parameters:
Before delving into the details, it's worth noting that the chosen number of periods (2870) is a personal preference. This specific value is utilized for the S&P 500 index due to its alignment with various theories regarding the beginning of the modern economic era in the stock market. Different analysts propose different starting points, such as the 1950s, 1970s, or 1980s. However, users are encouraged to adjust this parameter to suit their specific needs and trading strategies.
How It Works:
The "Regression Line (Log)" indicator operates by transforming the closing price data into a logarithmic scale. This transformation can make the linear regression more suitable for data with exponential trends or rapid growth. Here's a breakdown of its functioning and why it can be advantageous for long-term trend analysis:
1. Logarithmic Transformation: The indicator begins by applying a logarithmic transformation to the closing price. This transformation helps capture price movements proportionally, making it especially useful for assets that exhibit exponential or rapid growth. This transformation can render linear regression more suitable for data with exponential or fast-paced trends.
2. Linear Regression on Log Scale: After the logarithmic transformation, the indicator calculates a linear regression line (lrc) on this log-transformed data. This step provides a smoother representation of long-term trends compared to a linear regression line on a linear scale.
3. Exponential Reversion: To present the results in a more familiar format, the indicator reverts the log-transformed regression line back to a linear scale using the math.exp function. This final output is the "Linear Regression Curve," which can be easily interpreted on standard price charts.
Advantages:
- Long-Term Trend Clarity: The logarithmic scale better highlights long-term trends and exponential price movements, making it a valuable tool for investors seeking to identify extended trends.
- Smoothing Effect: The logarithmic transformation and linear regression on a log scale smooth out price data, reducing noise and providing a clearer view of underlying trends.
- Adaptability: The indicator allows traders and investors to customize the number of periods (length) to align with their preferred historical perspective or trading strategy.
- Complementary to Other Tools: While not meant to replace other technical indicators, the "Regression Line (Log)" indicator complements traditional linear regression lines and moving averages, offering an alternative perspective for more comprehensive analysis.
Conclusion:
In summary, the "Regression Line (Log)" indicator is a versatile tool that can enhance your ability to analyze long-term market trends. Its logarithmic transformation provides a unique perspective on price data, particularly suited for assets with exponential growth patterns. While the choice of the number of periods is a personal one, it can be adapted to fit various historical viewpoints. This indicator is best utilized as part of a well-rounded trading strategy, in conjunction with other technical tools, to aid in informed decision-making.
Phát hành các Ghi chú
deviation lines addedPhát hành các Ghi chú
MTF option addedPhát hành các Ghi chú
minor changesPhát hành các Ghi chú
minor changePhát hành các Ghi chú
I added an option to color the Regression Line based on the level of the Composite Leading Indicator, which can be chosen in the inputs (default is the USA's).Phát hành các Ghi chú
I added a smoothing approach for shorter timeframes.Phát hành các Ghi chú
Minor bugs fixedPhát hành các Ghi chú
Major Update: I've reverted to a classic approach by setting the regression length to 100 periods and using 1 and 2 standard deviation bands.
Phát hành các Ghi chú
Minor Update: Different style options have been added.Mã nguồn mở
Theo đúng tinh thần TradingView, tác giả của tập lệnh này đã công bố nó dưới dạng mã nguồn mở, để các nhà giao dịch có thể xem xét và xác minh chức năng. Chúc mừng tác giả! Mặc dù bạn có thể sử dụng miễn phí, hãy nhớ rằng việc công bố lại mã phải tuân theo Nội quy.
Plan the trade ⚡ Trade the plan
Thông báo miễn trừ trách nhiệm
Thông tin và các ấn phẩm này không nhằm mục đích, và không cấu thành, lời khuyên hoặc khuyến nghị về tài chính, đầu tư, giao dịch hay các loại khác do TradingView cung cấp hoặc xác nhận. Đọc thêm tại Điều khoản Sử dụng.
Mã nguồn mở
Theo đúng tinh thần TradingView, tác giả của tập lệnh này đã công bố nó dưới dạng mã nguồn mở, để các nhà giao dịch có thể xem xét và xác minh chức năng. Chúc mừng tác giả! Mặc dù bạn có thể sử dụng miễn phí, hãy nhớ rằng việc công bố lại mã phải tuân theo Nội quy.
Plan the trade ⚡ Trade the plan
Thông báo miễn trừ trách nhiệm
Thông tin và các ấn phẩm này không nhằm mục đích, và không cấu thành, lời khuyên hoặc khuyến nghị về tài chính, đầu tư, giao dịch hay các loại khác do TradingView cung cấp hoặc xác nhận. Đọc thêm tại Điều khoản Sử dụng.