OPEN-SOURCE SCRIPT
Cập nhật Linear Regression 200/100/50/20
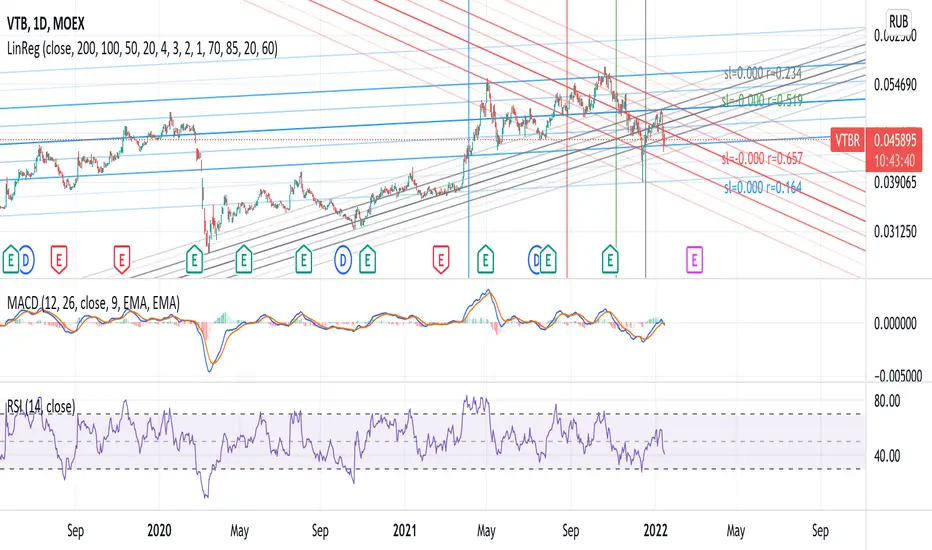
Four time frames in one indicator in different colors, showing current price trend in different scopes.
If the slope of the smaller time frame is in a (0,75;1,25) interval of some of the bigger ones the smaller one is omitted (different signs near zero are not coalesced in that way though).
Every time frame has four deltas of range in trend lines of different grade of transparency (2-1-4-3), as well as a vertical line denoting regression date range start, also bearing the same color (blue-red-green-gray for 200/100/50/20).
On the right of the latest bar are Pearson coefficients and slopes of the regressions, 200/100/50/20 bottom-up, also appropriately colored.
Phát hành các Ghi chú
Some of the trends can now be disabled in the config.Parameter layout fixes.
Phát hành các Ghi chú
Label format fix.Phát hành các Ghi chú
Added exponential scale support, should be selected manually in the config.Minor fixes
Phát hành các Ghi chú
Minor fix.Mã nguồn mở
Theo đúng tinh thần TradingView, tác giả của tập lệnh này đã công bố nó dưới dạng mã nguồn mở, để các nhà giao dịch có thể xem xét và xác minh chức năng. Chúc mừng tác giả! Mặc dù bạn có thể sử dụng miễn phí, hãy nhớ rằng việc công bố lại mã phải tuân theo Nội quy.
Thông báo miễn trừ trách nhiệm
Thông tin và các ấn phẩm này không nhằm mục đích, và không cấu thành, lời khuyên hoặc khuyến nghị về tài chính, đầu tư, giao dịch hay các loại khác do TradingView cung cấp hoặc xác nhận. Đọc thêm tại Điều khoản Sử dụng.
Mã nguồn mở
Theo đúng tinh thần TradingView, tác giả của tập lệnh này đã công bố nó dưới dạng mã nguồn mở, để các nhà giao dịch có thể xem xét và xác minh chức năng. Chúc mừng tác giả! Mặc dù bạn có thể sử dụng miễn phí, hãy nhớ rằng việc công bố lại mã phải tuân theo Nội quy.
Thông báo miễn trừ trách nhiệm
Thông tin và các ấn phẩm này không nhằm mục đích, và không cấu thành, lời khuyên hoặc khuyến nghị về tài chính, đầu tư, giao dịch hay các loại khác do TradingView cung cấp hoặc xác nhận. Đọc thêm tại Điều khoản Sử dụng.