OPEN-SOURCE SCRIPT
Cập nhật 4 EMA & MACD
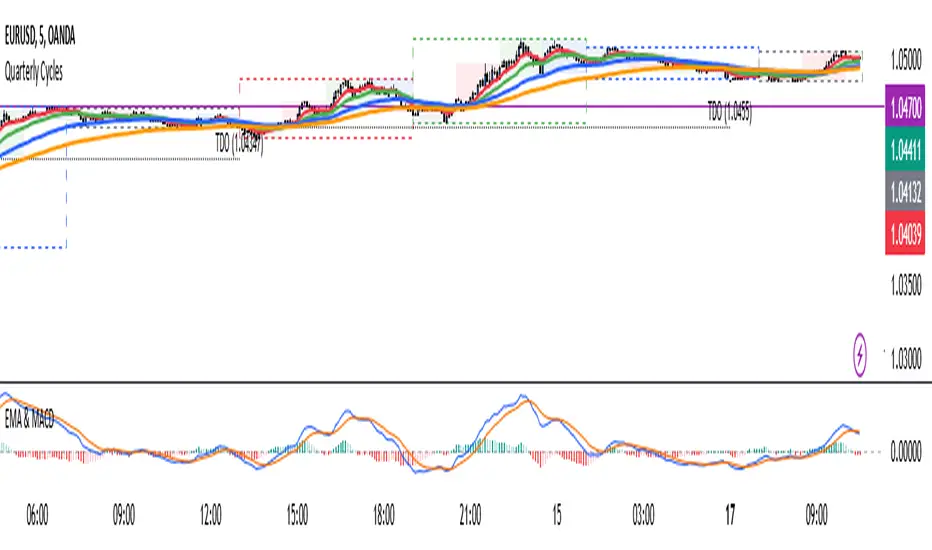
The indicator that combines Moving Average and MACD into one is very useful for providing a more complete picture of the market. Here's how it works:
Moving Average (MA): This is a trend indicator that smooths the price to show the dominant trend direction. MA helps traders determine whether the market is in an uptrend, downtrend, or sideways. For example, if the price is above the MA, it might indicate an uptrend, while if the price is below the MA, it might indicate a downtrend.
MACD (Moving Average Convergence Divergence): MACD measures market momentum and can provide entry and exit signals based on the difference between two moving averages (fast MA and slow MA). A buy signal occurs when the MACD crosses above the signal line, and a sell signal occurs when the MACD crosses below the signal line.
Combining both gives traders a more complete view:
MA provides an overview of the larger trend direction.
MACD helps identify moments when momentum supports a position for entering or exiting.
Common usage:
Entry: If the price is above the Moving Average (uptrend) and the MACD shows a buy signal (for example, MACD crossing above the signal line), it can be a signal to buy.
Exit: If the price starts moving below the MA and the MACD shows a sell signal, it can be a signal to sell or exit the position.
There is an indicator called MACD + Moving Average Cross, which combines both elements, providing stronger signals and making it easier to follow the market.
Phát hành các Ghi chú
update visual effect on MACDPhát hành các Ghi chú
Update the display of indicator settingsPhát hành các Ghi chú
This custom indicator combines Exponential Moving Averages (EMA) with a switchable RSI/MACD feature. Users can display four EMAs and toggle between RSI and MACD based on their trading preferences.Phát hành các Ghi chú
I removed RSI from this indicator and changed it to the previous version without RSI.Phát hành các Ghi chú
Indikator ini menggabungkan tiga elemen utama dalam strategi trading, yaitu Exponential Moving Average (EMA), Moving Average Convergence Divergence (MACD), dan Average True Range (ATR) Stop Loss. EMA digunakan untuk mengidentifikasi tren pasar dengan melihat pergerakan harga rata-rata dalam berbagai periode waktu. Kombinasi beberapa EMA membantu trader menentukan arah tren, mengidentifikasi potensi pembalikan, serta menemukan area support dan resistance dinamis.MACD berfungsi untuk mengukur kekuatan tren dan momentum harga. Indikator ini membantu trader mengenali perubahan tren berdasarkan hubungan antara dua moving average serta histogram yang menunjukkan perbedaan di antara keduanya. Sinyal yang dihasilkan dapat digunakan untuk menentukan potensi entry dan exit berdasarkan perubahan momentum pasar.
Sementara itu, ATR Stop Loss digunakan sebagai alat manajemen risiko dengan menentukan level stop loss yang menyesuaikan dengan volatilitas pasar. Saat volatilitas tinggi, jarak stop loss akan lebih luas untuk menghindari stop out prematur, sedangkan saat volatilitas rendah, stop loss akan lebih ketat untuk meminimalkan risiko. Kombinasi ketiga indikator ini memungkinkan trader untuk mengikuti tren dengan lebih efektif, mendapatkan konfirmasi entry yang lebih kuat, serta mengelola risiko secara lebih adaptif sesuai kondisi pasar.
Phát hành các Ghi chú
adding ATR Stoploss feature.Mã nguồn mở
Theo đúng tinh thần TradingView, tác giả của tập lệnh này đã công bố nó dưới dạng mã nguồn mở, để các nhà giao dịch có thể xem xét và xác minh chức năng. Chúc mừng tác giả! Mặc dù bạn có thể sử dụng miễn phí, hãy nhớ rằng việc công bố lại mã phải tuân theo Nội quy.
Thông báo miễn trừ trách nhiệm
Thông tin và các ấn phẩm này không nhằm mục đích, và không cấu thành, lời khuyên hoặc khuyến nghị về tài chính, đầu tư, giao dịch hay các loại khác do TradingView cung cấp hoặc xác nhận. Đọc thêm tại Điều khoản Sử dụng.
Mã nguồn mở
Theo đúng tinh thần TradingView, tác giả của tập lệnh này đã công bố nó dưới dạng mã nguồn mở, để các nhà giao dịch có thể xem xét và xác minh chức năng. Chúc mừng tác giả! Mặc dù bạn có thể sử dụng miễn phí, hãy nhớ rằng việc công bố lại mã phải tuân theo Nội quy.
Thông báo miễn trừ trách nhiệm
Thông tin và các ấn phẩm này không nhằm mục đích, và không cấu thành, lời khuyên hoặc khuyến nghị về tài chính, đầu tư, giao dịch hay các loại khác do TradingView cung cấp hoặc xác nhận. Đọc thêm tại Điều khoản Sử dụng.