PROTECTED SOURCE SCRIPT
Sen Regression Channel
Sen Regression Channel
OVERVIEW
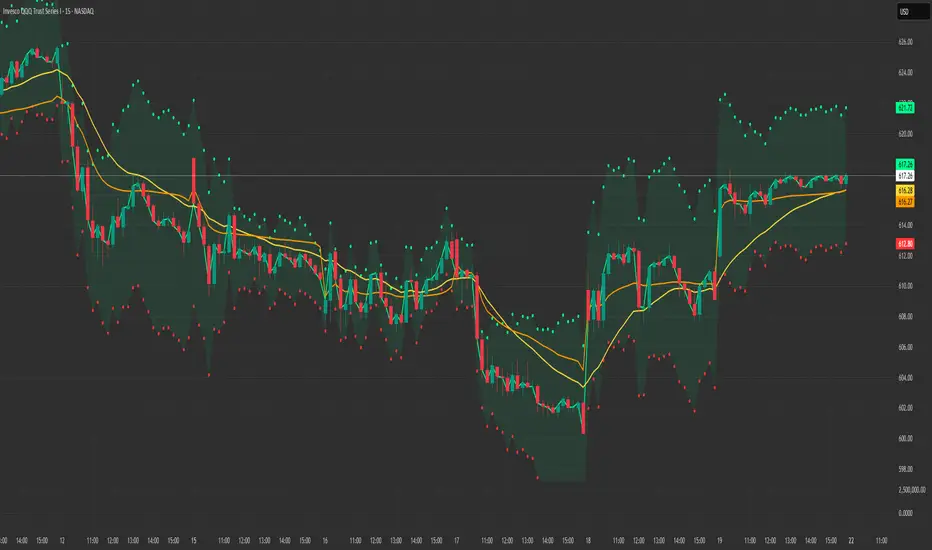
The Sen Regression Channel is a trend-structure visualization tool built on the Theil–Sen estimator, a median-based regression method designed to reduce sensitivity to price outliers. Unlike traditional least-squares regression channels, this approach anchors trend using the most representative slope across the lookback period, resulting in a more stable and noise-resistant structure.
TECHNICAL LOGIC & ORIGINALITY
To protect the proprietary implementation of the median-slope engine and adaptive band construction, this script is published as Protected.
Median Slope Engine
Calculates the Theil–Sen slope by evaluating the median rate of change across the lookback window, producing a trendline less distorted by extreme candles or transient volatility.
Adaptive Volatility Bands
Channel width can be derived from either Standard Deviation or ATR, allowing the envelope to adjust dynamically to changing volatility regimes.
Multi-Reference Context (Optional)
VWAP and EMA/SMA overlays can be enabled to compare the median regression structure against commonly used price and volume-weighted references.
HOW TO USE (EDUCATIONAL)
This tool is designed to help analyze trend quality and market structure, not to generate trade signals.
Trend Direction & Stability
A sustained upward or downward slope of the median regression line indicates directional structure with reduced noise sensitivity.
Volatility Expansion Zones
Price closing outside the channel bands highlights volatility expansion relative to the median trend and may signal regime change.
Mean-Reversion Context
Price oscillation between the median line and bands reflects balanced conditions; movement toward the outer bands indicates relative extension.
VWAP Confluence
Alignment between the regression midline and VWAP may highlight areas of consensus value.
USER INPUTS
Lookback Period – Sets the window for the median slope calculation
Band Multiplier – Scales the channel width
Band Method – Standard Deviation or ATR-based envelope
Visual Overlays – Toggle VWAP, midline, and cloud transparency
NOTES
This script is a historical charting and visualization tool for educational purposes only.
It does not provide trade signals, alerts, or financial advice.
All values are calculated in real time using available chart data.
OVERVIEW
The Sen Regression Channel is a trend-structure visualization tool built on the Theil–Sen estimator, a median-based regression method designed to reduce sensitivity to price outliers. Unlike traditional least-squares regression channels, this approach anchors trend using the most representative slope across the lookback period, resulting in a more stable and noise-resistant structure.
TECHNICAL LOGIC & ORIGINALITY
To protect the proprietary implementation of the median-slope engine and adaptive band construction, this script is published as Protected.
Median Slope Engine
Calculates the Theil–Sen slope by evaluating the median rate of change across the lookback window, producing a trendline less distorted by extreme candles or transient volatility.
Adaptive Volatility Bands
Channel width can be derived from either Standard Deviation or ATR, allowing the envelope to adjust dynamically to changing volatility regimes.
Multi-Reference Context (Optional)
VWAP and EMA/SMA overlays can be enabled to compare the median regression structure against commonly used price and volume-weighted references.
HOW TO USE (EDUCATIONAL)
This tool is designed to help analyze trend quality and market structure, not to generate trade signals.
Trend Direction & Stability
A sustained upward or downward slope of the median regression line indicates directional structure with reduced noise sensitivity.
Volatility Expansion Zones
Price closing outside the channel bands highlights volatility expansion relative to the median trend and may signal regime change.
Mean-Reversion Context
Price oscillation between the median line and bands reflects balanced conditions; movement toward the outer bands indicates relative extension.
VWAP Confluence
Alignment between the regression midline and VWAP may highlight areas of consensus value.
USER INPUTS
Lookback Period – Sets the window for the median slope calculation
Band Multiplier – Scales the channel width
Band Method – Standard Deviation or ATR-based envelope
Visual Overlays – Toggle VWAP, midline, and cloud transparency
NOTES
This script is a historical charting and visualization tool for educational purposes only.
It does not provide trade signals, alerts, or financial advice.
All values are calculated in real time using available chart data.
Mã được bảo vệ
Tập lệnh này được đăng dưới dạng mã nguồn đóng. Tuy nhiên, bạn có thể sử dụng tự do và không giới hạn – tìm hiểu thêm tại đây.
💎 PRO Scripts
➜ VAULT-All Products (Free 7 Day Trial) gammabull.gumroad.com/l/rytfvb
Until Jan 31st use Code VAULT28=$28 first Month→$55/mo
→ Main Product Page: gammabull.gumroad.com/
Code PACK10 at checkout for 10% off all products
➜ VAULT-All Products (Free 7 Day Trial) gammabull.gumroad.com/l/rytfvb
Until Jan 31st use Code VAULT28=$28 first Month→$55/mo
→ Main Product Page: gammabull.gumroad.com/
Code PACK10 at checkout for 10% off all products
Thông báo miễn trừ trách nhiệm
Thông tin và các ấn phẩm này không nhằm mục đích, và không cấu thành, lời khuyên hoặc khuyến nghị về tài chính, đầu tư, giao dịch hay các loại khác do TradingView cung cấp hoặc xác nhận. Đọc thêm tại Điều khoản Sử dụng.