OPEN-SOURCE SCRIPT
Cập nhật TICK Charting & Divergences
Overview
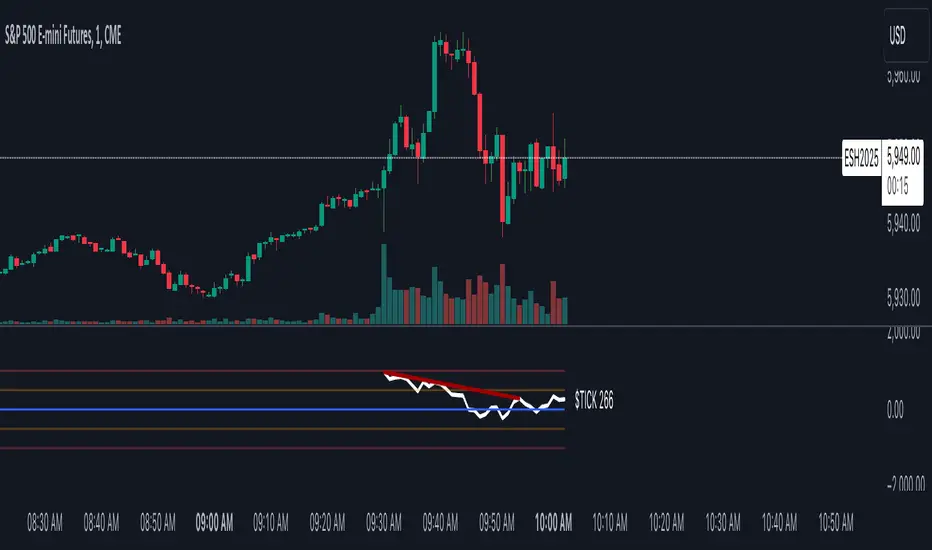
The TICK index measures the number of NYSE stocks making an uptick versus a downtick. This indicator identifies divergences between price action and TICK readings, potentially signaling trend reversals.
Key Features
TICK Internals Interpretation
Best Practices
Settings Optimization
Warning Signs
Remember: TICK divergences are not guaranteed signals. Always use proper risk management and combine with other technical analysis tools.
The TICK index measures the number of NYSE stocks making an uptick versus a downtick. This indicator identifies divergences between price action and TICK readings, potentially signaling trend reversals.
Key Features
- Real-time TICK monitoring during market hours (9:30 AM - 4:00 PM ET)
- Customizable smoothing factor for TICK values
- Regular and hidden divergences detection
- Reference lines at ±500 and ±1000 levels
- Current TICK value display
TICK Internals Interpretation
- Above +1000: Strong buying pressure, potential exhaustion
- Above +500: Moderate buying pressure
- Below -500: Moderate selling pressure
- Below -1000: Strong selling pressure, potential exhaustion
Best Practices
- Use in conjunction with support/resistance levels, market trend direction, and time of day.
- Higher probability setups with multiple timeframe confirmation, divergence at key price levels, and extreme TICK readings (±1000).
Settings Optimization
- Smoothing Factor: 1-3 (lower for faster signals)
- Pivot Lookback: 5-10 bars (adjust based on timeframe)
- Range: 5-60 bars (wider for longer-term signals)
Warning Signs
- Multiple failed divergences
- Choppy price action
- Low volume periods
- Major news events pending
Remember: TICK divergences are not guaranteed signals. Always use proper risk management and combine with other technical analysis tools.
Phát hành các Ghi chú
Updated with better chart image.Phát hành các Ghi chú
Updated naming in indicator pane.Mã nguồn mở
Theo đúng tinh thần TradingView, tác giả của tập lệnh này đã công bố nó dưới dạng mã nguồn mở, để các nhà giao dịch có thể xem xét và xác minh chức năng. Chúc mừng tác giả! Mặc dù bạn có thể sử dụng miễn phí, hãy nhớ rằng việc công bố lại mã phải tuân theo Nội quy.
Thông báo miễn trừ trách nhiệm
Thông tin và các ấn phẩm này không nhằm mục đích, và không cấu thành, lời khuyên hoặc khuyến nghị về tài chính, đầu tư, giao dịch hay các loại khác do TradingView cung cấp hoặc xác nhận. Đọc thêm tại Điều khoản Sử dụng.
Mã nguồn mở
Theo đúng tinh thần TradingView, tác giả của tập lệnh này đã công bố nó dưới dạng mã nguồn mở, để các nhà giao dịch có thể xem xét và xác minh chức năng. Chúc mừng tác giả! Mặc dù bạn có thể sử dụng miễn phí, hãy nhớ rằng việc công bố lại mã phải tuân theo Nội quy.
Thông báo miễn trừ trách nhiệm
Thông tin và các ấn phẩm này không nhằm mục đích, và không cấu thành, lời khuyên hoặc khuyến nghị về tài chính, đầu tư, giao dịch hay các loại khác do TradingView cung cấp hoặc xác nhận. Đọc thêm tại Điều khoản Sử dụng.