PROTECTED SOURCE SCRIPT
DexFxMarkets Support & Resistance
This script uses a combination of several daily and timeframe variables and Fibonacci turning points/ pivot points .
It is efficient on all time frames
Easy to overlay your favorite strategy
Defaults are set to primary colors and work well with dark themes.
Using the Support and resistance indicator will gather information on Pivot regions on all time frames.
It also Uses fibonacci reasoning and combined with said pivot tables gives you a result that can help you Identify Support and resistance for pull backs and Break throughs.
Couple this with your favorite indicator and use it to create areas around your trade.
Take profit areas stop loss regions and so forth.
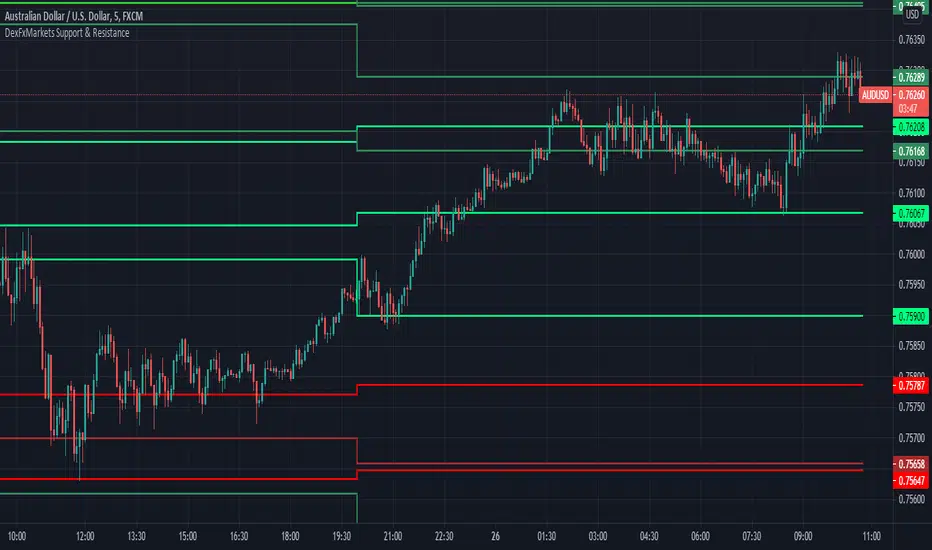
Light Green and dark green lines above your price are recommended heavy resistance lines, the light green being intraday established while the dark Green means they have a history of those price levels.
While Red Lines are heavy Sell off areas
Remember that Support and Resistance is never total about the Line but more of a zone... investigate and do not hesitate to ask questions in the comments.
Support and Resistance is one of the most used techniques in technical analysis based on a concept that's easy to understand but difficult to master. It identifies price levels where historically the price reacted either by reversing or at least by slowing down and prior price behavior at these levels can leave clues for future price behavior. There are many different ways to identify these levels and to apply them in trading.
Support and Resistance levels can be identifiable turning points, areas of congestion or psychological levels (round numbers that traders attach significance to). The higher the timeframe, the more relevant the levels become.
It is efficient on all time frames
Easy to overlay your favorite strategy
Defaults are set to primary colors and work well with dark themes.
Using the Support and resistance indicator will gather information on Pivot regions on all time frames.
It also Uses fibonacci reasoning and combined with said pivot tables gives you a result that can help you Identify Support and resistance for pull backs and Break throughs.
Couple this with your favorite indicator and use it to create areas around your trade.
Take profit areas stop loss regions and so forth.
Light Green and dark green lines above your price are recommended heavy resistance lines, the light green being intraday established while the dark Green means they have a history of those price levels.
While Red Lines are heavy Sell off areas
Remember that Support and Resistance is never total about the Line but more of a zone... investigate and do not hesitate to ask questions in the comments.
Support and Resistance is one of the most used techniques in technical analysis based on a concept that's easy to understand but difficult to master. It identifies price levels where historically the price reacted either by reversing or at least by slowing down and prior price behavior at these levels can leave clues for future price behavior. There are many different ways to identify these levels and to apply them in trading.
Support and Resistance levels can be identifiable turning points, areas of congestion or psychological levels (round numbers that traders attach significance to). The higher the timeframe, the more relevant the levels become.
Mã được bảo vệ
Tập lệnh này được đăng dưới dạng mã nguồn đóng. Tuy nhiên, bạn có thể sử dụng tự do và không giới hạn – tìm hiểu thêm tại đây.
TraderMaxx
Request Indicators
shougncrypto.com
Request Indicators
shougncrypto.com
Thông báo miễn trừ trách nhiệm
Thông tin và các ấn phẩm này không nhằm mục đích, và không cấu thành, lời khuyên hoặc khuyến nghị về tài chính, đầu tư, giao dịch hay các loại khác do TradingView cung cấp hoặc xác nhận. Đọc thêm tại Điều khoản Sử dụng.