PROTECTED SOURCE SCRIPT
bakkta`s stochastic
Hey. This is bakkta.
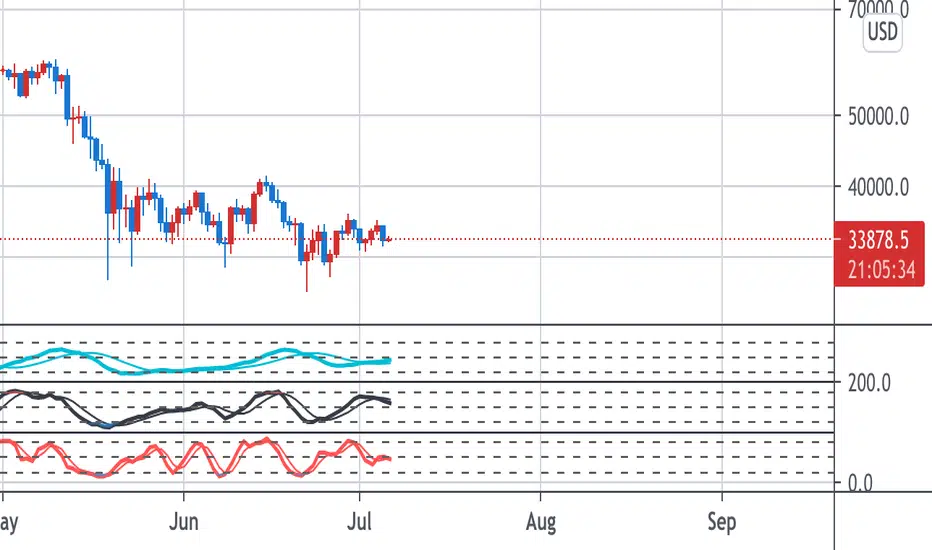
These are three stochastics when I trade. These stochastics` settings are subdivided. So we can predict the next movement if we use the time frame appropriately.
I call them “Big Wave”, “Middle Wave”, “Small Wave” from upper stochastic in order. Each stochastics` color is light blue(B.W.), black(M.W.) and red(S.W.). These colors are the same as the thing of 10M.A., 5M.A. and candle. In other words, When we find the divergences of stochastic, we have to compare B.W. with 10M.A., M.W. with 5M.A. and S.W. with candles.
Big Wave divergence is the most powerful wave and Small Wave divergence is the most weak wave. If we can see the Big wave divergence , It will be possible for the candle to reach a maximum 120M.A.
If the Middle Wave is observed in chart, candle will hit a maximum 60-day moving average. And If the Small Wave is shown us, candle will reach a maximum 20-day moving average. Besides there are a lot of conditions. But It's so complicated and long. So I`ll just shorten the explanation.
This indicator can apply to any market for example stocks, futures, forex, Cfds etc. You don't need to control the setting of this indicator. You can just use because there is only one principle to apply to this.
If you want more information , check my profile. Tha!
Mã được bảo vệ
Tập lệnh này được đăng dưới dạng mã nguồn đóng. Tuy nhiên, bạn có thể sử dụng tự do và không giới hạn – tìm hiểu thêm tại đây.
NO.1 Trading Coach in south korea
Thông báo miễn trừ trách nhiệm
Thông tin và các ấn phẩm này không nhằm mục đích, và không cấu thành, lời khuyên hoặc khuyến nghị về tài chính, đầu tư, giao dịch hay các loại khác do TradingView cung cấp hoặc xác nhận. Đọc thêm tại Điều khoản Sử dụng.