OPEN-SOURCE SCRIPT
Bijnor Pivot Extended
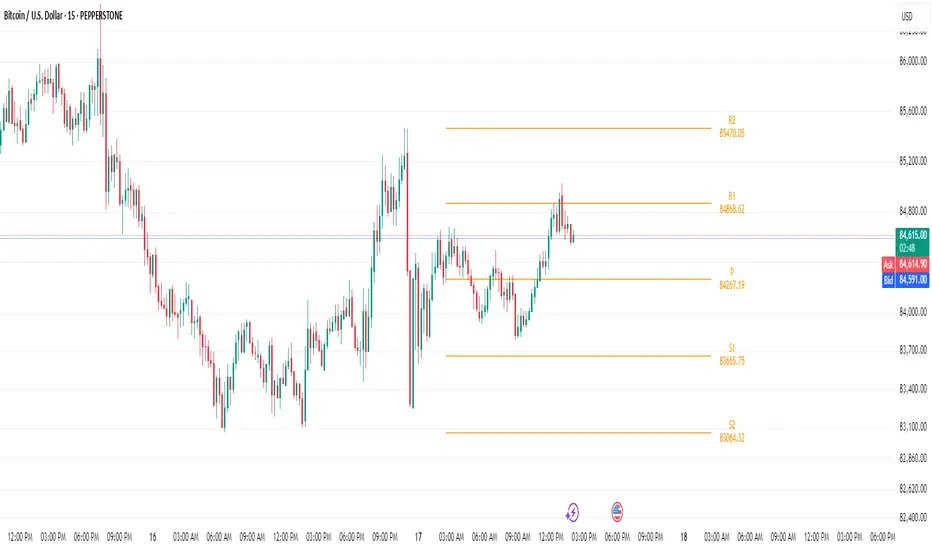
Overview: The Bijnor Pivot Extended (BP+) indicator is a powerful visual tool designed to help traders identify key price levels using Fibonacci-based pivots. It dynamically plots Support and Resistance levels based on your chosen timeframe (Daily, Weekly, or Monthly) and displays them only for the current session, reducing chart clutter and improving focus.
🔧 Features:
📆 Pivot Timeframe Selection: Choose between Daily, Weekly, or Monthly pivots.
🎯 Fibonacci Pivot Levels:
Central Pivot (P)
Resistance: R1, R2, R3, R4 (Extended)
Support: S1, S2, S3, S4 (Extended)
🎨 Full Customization:
Toggle labels and prices on/off
Position labels to the left or right
Change line width and individual colors for pivot, support, and resistance lines
🧠 Smart Line Plotting:
Lines are drawn only during the selected session, keeping your chart clean
🕹️ Max Performance: Optimized to stay lightweight with max_lines_count and max_labels_count set to 500
🧭 How to Use It:
Use this indicator to:
Plan entries and exits around key Fibonacci pivot zones
Identify overbought/oversold zones at R3/R4 and S3/S4
Enhance your intraday, swing, or positional trading setups
Combine with price action, candlestick patterns, or volume for maximum edge.
✅ Bonus:
This script is ideal for traders looking for a minimalist yet powerful pivot framework, with extended levels for breakout or reversal scenarios.
Mã nguồn mở
Theo đúng tinh thần TradingView, tác giả của tập lệnh này đã công bố nó dưới dạng mã nguồn mở, để các nhà giao dịch có thể xem xét và xác minh chức năng. Chúc mừng tác giả! Mặc dù bạn có thể sử dụng miễn phí, hãy nhớ rằng việc công bố lại mã phải tuân theo Nội quy.
Thông báo miễn trừ trách nhiệm
Thông tin và các ấn phẩm này không nhằm mục đích, và không cấu thành, lời khuyên hoặc khuyến nghị về tài chính, đầu tư, giao dịch hay các loại khác do TradingView cung cấp hoặc xác nhận. Đọc thêm tại Điều khoản Sử dụng.