OPEN-SOURCE SCRIPT
Cập nhật Exertion Meter
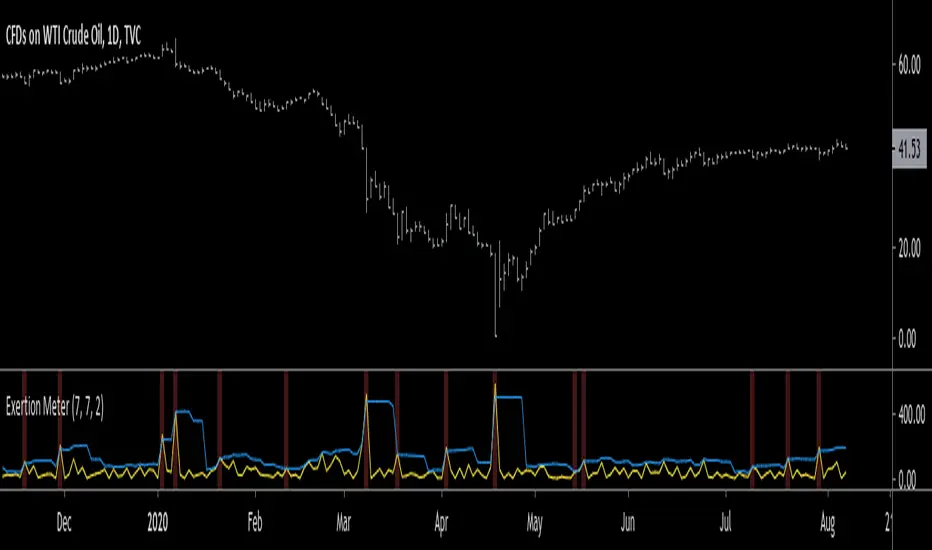
Hello traders, today I wanted to present you something special. I present you the Exertion Meter!
Created from scratch, this idea is based on a theory of mine called "Exertion".
Exertion occurs when price moves beyond the previous bar's range thus it has "exerted itself".
The idea is that when price moves a lot, it exerts a lot of energy which eventually leads to calmer motion, usually in the direction price has exerted itself.
Now, when price has exerted itself a lot in a particular direction, it's telling you that it will likely continue in that direction.
Once this happens, it will gradually calm down until price begins the cycle again, exerting itself in either the same or opposite direction.
This theory is similar to the theory of expansion & contraction phases.
This indicator attempts to show you where price has exerted itself by giving you a two lines cross signal.
The default settings are recommended, but experimentation is encouraged to fit your own personal system.
Both settings control the standard deviation line ( aka . Upper Bollinger Band ).
Enjoy, and hit the follow button to get easy access to all my indicators and to follow my latest publications!
Phát hành các Ghi chú
Changed colors of standard deviation line (red > blue)Phát hành các Ghi chú
Added a third parameter: (Line 1 Length)Phát hành các Ghi chú
Added background colors to show when signal occurs :)Phát hành các Ghi chú
changed background color.red to na.Mã nguồn mở
Theo đúng tinh thần TradingView, tác giả của tập lệnh này đã công bố nó dưới dạng mã nguồn mở, để các nhà giao dịch có thể xem xét và xác minh chức năng. Chúc mừng tác giả! Mặc dù bạn có thể sử dụng miễn phí, hãy nhớ rằng việc công bố lại mã phải tuân theo Nội quy.
Thông báo miễn trừ trách nhiệm
Thông tin và các ấn phẩm này không nhằm mục đích, và không cấu thành, lời khuyên hoặc khuyến nghị về tài chính, đầu tư, giao dịch hay các loại khác do TradingView cung cấp hoặc xác nhận. Đọc thêm tại Điều khoản Sử dụng.
Mã nguồn mở
Theo đúng tinh thần TradingView, tác giả của tập lệnh này đã công bố nó dưới dạng mã nguồn mở, để các nhà giao dịch có thể xem xét và xác minh chức năng. Chúc mừng tác giả! Mặc dù bạn có thể sử dụng miễn phí, hãy nhớ rằng việc công bố lại mã phải tuân theo Nội quy.
Thông báo miễn trừ trách nhiệm
Thông tin và các ấn phẩm này không nhằm mục đích, và không cấu thành, lời khuyên hoặc khuyến nghị về tài chính, đầu tư, giao dịch hay các loại khác do TradingView cung cấp hoặc xác nhận. Đọc thêm tại Điều khoản Sử dụng.