OPEN-SOURCE SCRIPT
Cập nhật Key Points of Adjoining Median (KPAM)
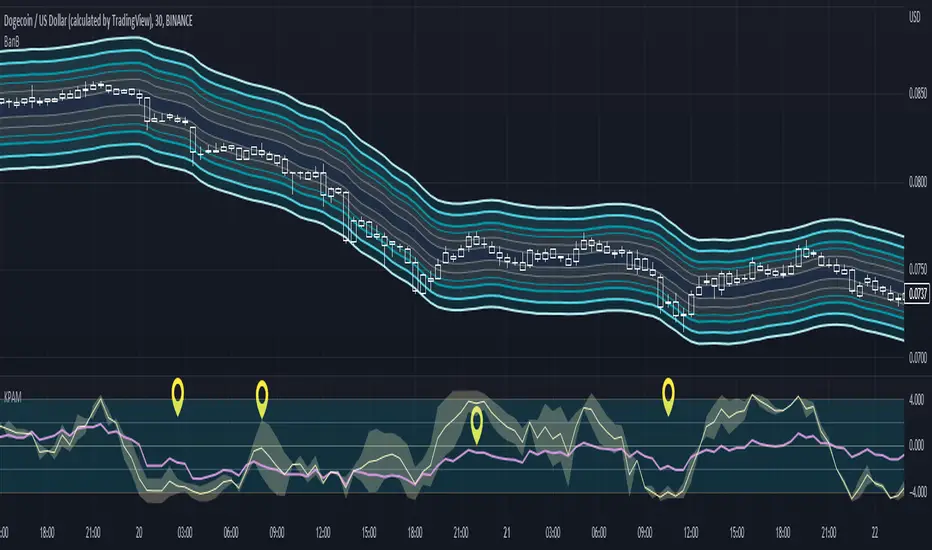
This indicator shows more reliable overbought & oversold levels buy combing 3 different level-indicators (i.e., indicators showing overbought/oversold levels).
A median is created by adjoining two of them and then it is assisted by a third one.
This reduces noise in calculating entries when using level indicators.
Note: The extra indicator shown is "Bands Bands (BanB)"
----- HOW TO USE IT -----
Use with price-action trading and with indicators showing the overall trend.
See notes in chart for more explanation.
The high and low levels of the RSI are within a range of 2 & -2 respectively.
The high and low levels for the median range from 4 & -4 respectively.
The Discordance shows how certain the level of the median is.
For example, if a part of the Discordance touches a low level while the median is at a higher level, then it usually indicates that the median is about to reverse.
The more Discordance that is visible, the less certain the current trend of the median is.
----- HOW THIS INDICATOR IS ORIGINAL; WHAT IT DOES AND HOW IT DOES IT -----
This indicator has an original, unique ability to reduce noise when comparing overbought and oversold levels.
It does this by first adjoining the Stochastic and the Stochastic RSI. Second, it creates a median from the two.
Third, the median is compared to the RSI on the same scale to assist in deciding where the median is at in relation to itself.
It shows whether the median lows and highs are near overbought or oversold levels.
----- VERSION -----
This is not a variant of the Stochastic, Stochastic RSI, and/or the RSI.
The focus is on the median that is created by an adjoining of the Stochastic and Stochastic RSI.
The Stochastic and Stochastic RSI are needed in order to obtain and plot the Median and the Discordance.
The RSI is plotted on the same scale to serve as the comparison needed to evaluate the Median levels with more visual accuracy.
Phát hành các Ghi chú
Added additional customization options for more visual clarity.Phát hành các Ghi chú
Added an EMA of the KPAM.Mã nguồn mở
Theo đúng tinh thần TradingView, tác giả của tập lệnh này đã công bố nó dưới dạng mã nguồn mở, để các nhà giao dịch có thể xem xét và xác minh chức năng. Chúc mừng tác giả! Mặc dù bạn có thể sử dụng miễn phí, hãy nhớ rằng việc công bố lại mã phải tuân theo Nội quy.
Thông báo miễn trừ trách nhiệm
Thông tin và các ấn phẩm này không nhằm mục đích, và không cấu thành, lời khuyên hoặc khuyến nghị về tài chính, đầu tư, giao dịch hay các loại khác do TradingView cung cấp hoặc xác nhận. Đọc thêm tại Điều khoản Sử dụng.
Mã nguồn mở
Theo đúng tinh thần TradingView, tác giả của tập lệnh này đã công bố nó dưới dạng mã nguồn mở, để các nhà giao dịch có thể xem xét và xác minh chức năng. Chúc mừng tác giả! Mặc dù bạn có thể sử dụng miễn phí, hãy nhớ rằng việc công bố lại mã phải tuân theo Nội quy.
Thông báo miễn trừ trách nhiệm
Thông tin và các ấn phẩm này không nhằm mục đích, và không cấu thành, lời khuyên hoặc khuyến nghị về tài chính, đầu tư, giao dịch hay các loại khác do TradingView cung cấp hoặc xác nhận. Đọc thêm tại Điều khoản Sử dụng.