OPEN-SOURCE SCRIPT
Cập nhật Modified Chaikin Oscillator
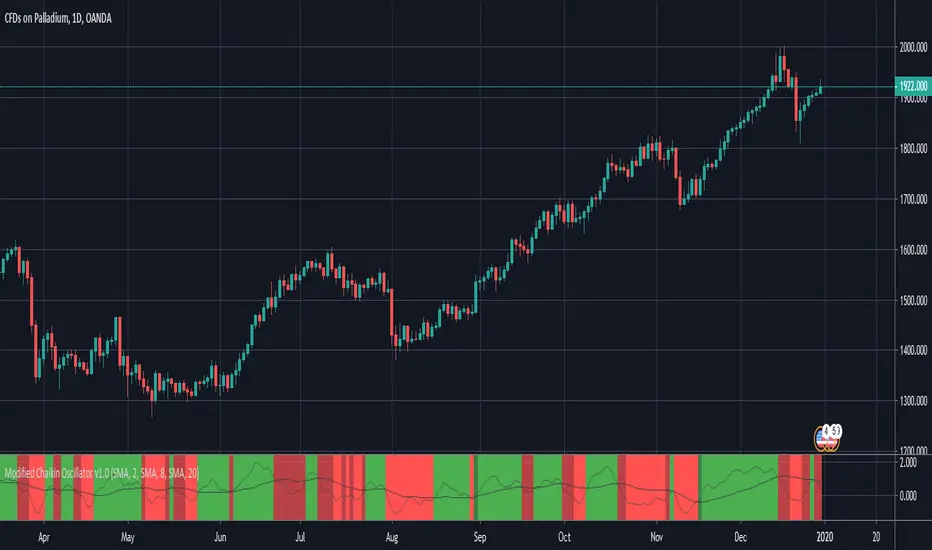
This is a modified version of the Chaikin Oscillator. The idea is to find accumulation and distribution phases in the market to identify when institutions are building their positions.
It uses acc/dist but as an oscillator, just like the Chaikin Oscillator, but not to find overbought or oversold areas, but to find trends. It functions like a MACD. It takes a fast moving average of the acc/dist and a slow moving average of the acc/dist, and plots the differense to create the oscillator, and uses a signal line to use for entries.
A strong signal is when the oscillator crosses the signal line while the signal line is on he right side of 0. So a crossover (long) when the signal line is below 0 woul be a weak signal, while a crossover (long) when the signal line is above 0 would be a strong signal.
By default, tick volume is discarded in the calculation, which makes this version behave a bit differently than the standard Chaikin Oscillator. This is because the indicator is mostly used to trade CFD's. If used to trade stocks for example, it is better to include the volume by unchecking that checkbox in the indicator settings.
BRIGHT GREEN = Strong signal LONG (signal line is above 0)
DARK GREEN = Weak signal LONG (signal line is below 0)
BRIGHT RED = Strong signal SHORT (signal line is below 0)
DARK RED = Weak signal SHORT (signal line is above 0)
Phát hành các Ghi chú
No changes. New snapshot needed to follow house rules.Mã nguồn mở
Theo đúng tinh thần TradingView, tác giả của tập lệnh này đã công bố nó dưới dạng mã nguồn mở, để các nhà giao dịch có thể xem xét và xác minh chức năng. Chúc mừng tác giả! Mặc dù bạn có thể sử dụng miễn phí, hãy nhớ rằng việc công bố lại mã phải tuân theo Nội quy.
Thông báo miễn trừ trách nhiệm
Thông tin và các ấn phẩm này không nhằm mục đích, và không cấu thành, lời khuyên hoặc khuyến nghị về tài chính, đầu tư, giao dịch hay các loại khác do TradingView cung cấp hoặc xác nhận. Đọc thêm tại Điều khoản Sử dụng.
Mã nguồn mở
Theo đúng tinh thần TradingView, tác giả của tập lệnh này đã công bố nó dưới dạng mã nguồn mở, để các nhà giao dịch có thể xem xét và xác minh chức năng. Chúc mừng tác giả! Mặc dù bạn có thể sử dụng miễn phí, hãy nhớ rằng việc công bố lại mã phải tuân theo Nội quy.
Thông báo miễn trừ trách nhiệm
Thông tin và các ấn phẩm này không nhằm mục đích, và không cấu thành, lời khuyên hoặc khuyến nghị về tài chính, đầu tư, giao dịch hay các loại khác do TradingView cung cấp hoặc xác nhận. Đọc thêm tại Điều khoản Sử dụng.