OPEN-SOURCE SCRIPT
Vector Candles
Title: Vector Candles Indicator with PVSRA
Short Description: Visualize climax and above-average volume candles using PVSRA method for trend reversals and significant moves.
Long Description:
The Vector Candles Indicator with PVSRA (Price, Volume, Support, and Resistance Analysis) is designed to help traders visualize climax and above-average volume candles on the chart, which can indicate potential trend reversals and significant market moves. This indicator is suitable for various financial instruments, including stocks, forex, and cryptocurrencies.
This script uses the PVSRA method to determine the candle colour based on volume and price action. By analysing the relationships between price, volume, and support/resistance levels, it allows traders to better understand the market dynamics and make informed decisions.
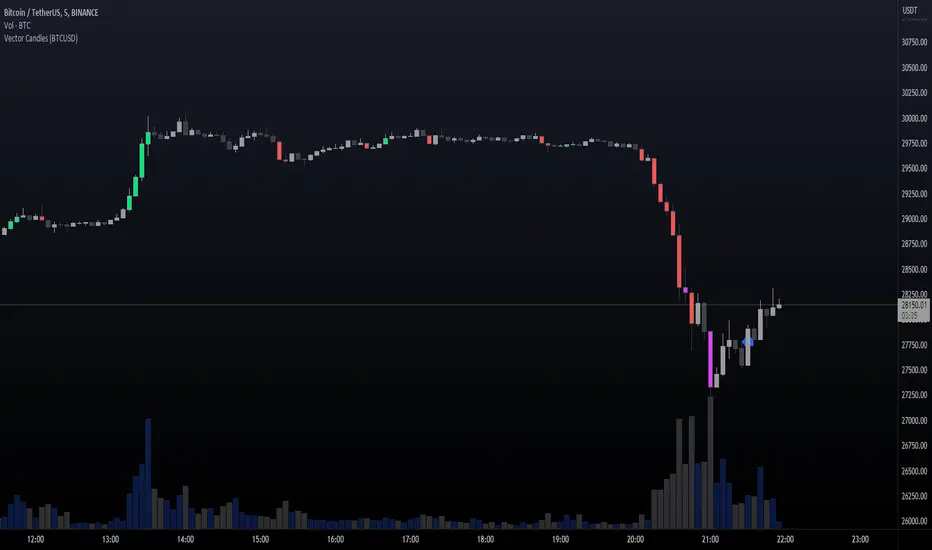
The indicator displays candles in different colours to represent the volume and price action:
Climax Up (Lime): Bullish candle with high volume
Climax Down (Red): Bearish candle with high volume
Above Average Up (Blue): Bullish candle with above-average volume
Above Average Down (Fuchsia): Bearish candle with above-average volume
Normal Up (Gray): Bullish candle with normal volume
Normal Down (Dark Gray): Bearish candle with normal volume
The script is designed to work on the TradingView platform and is based on original contributions by plasmapug, infernix, peshocore, and xtech5192. It has been modified RapidFireOG for easy integration into your trading setup.
Add this powerful tool to your chart and enhance your trading analysis with the Vector Candles Indicator with PVSRA.
Short Description: Visualize climax and above-average volume candles using PVSRA method for trend reversals and significant moves.
Long Description:
The Vector Candles Indicator with PVSRA (Price, Volume, Support, and Resistance Analysis) is designed to help traders visualize climax and above-average volume candles on the chart, which can indicate potential trend reversals and significant market moves. This indicator is suitable for various financial instruments, including stocks, forex, and cryptocurrencies.
This script uses the PVSRA method to determine the candle colour based on volume and price action. By analysing the relationships between price, volume, and support/resistance levels, it allows traders to better understand the market dynamics and make informed decisions.
The indicator displays candles in different colours to represent the volume and price action:
Climax Up (Lime): Bullish candle with high volume
Climax Down (Red): Bearish candle with high volume
Above Average Up (Blue): Bullish candle with above-average volume
Above Average Down (Fuchsia): Bearish candle with above-average volume
Normal Up (Gray): Bullish candle with normal volume
Normal Down (Dark Gray): Bearish candle with normal volume
The script is designed to work on the TradingView platform and is based on original contributions by plasmapug, infernix, peshocore, and xtech5192. It has been modified RapidFireOG for easy integration into your trading setup.
Add this powerful tool to your chart and enhance your trading analysis with the Vector Candles Indicator with PVSRA.
Mã nguồn mở
Theo đúng tinh thần TradingView, tác giả của tập lệnh này đã công bố nó dưới dạng mã nguồn mở, để các nhà giao dịch có thể xem xét và xác minh chức năng. Chúc mừng tác giả! Mặc dù bạn có thể sử dụng miễn phí, hãy nhớ rằng việc công bố lại mã phải tuân theo Nội quy.
Thông báo miễn trừ trách nhiệm
Thông tin và các ấn phẩm này không nhằm mục đích, và không cấu thành, lời khuyên hoặc khuyến nghị về tài chính, đầu tư, giao dịch hay các loại khác do TradingView cung cấp hoặc xác nhận. Đọc thêm tại Điều khoản Sử dụng.