OPEN-SOURCE SCRIPT
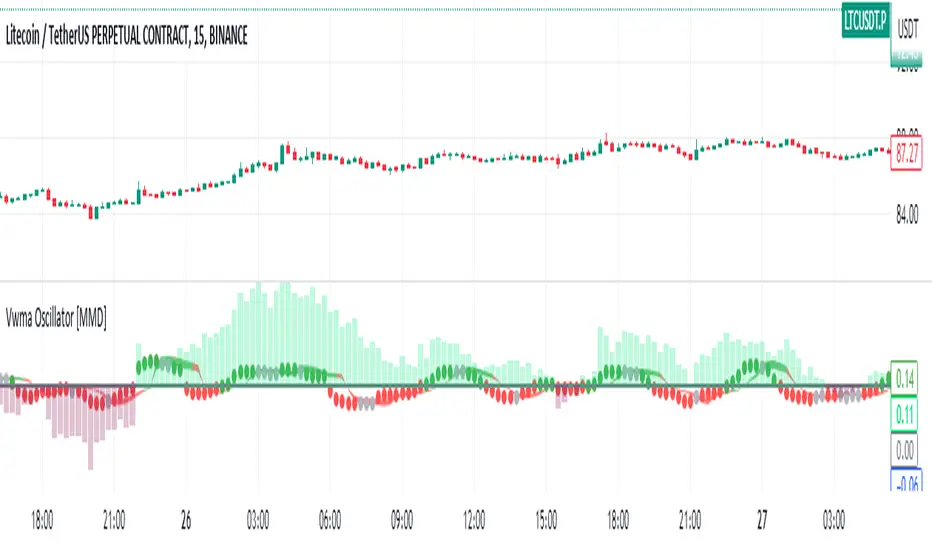
Cập nhật Vwma Oscillator [MMD]
This line calculates the exponential moving average (EMA) of the product of the close price and volume, divided by the EMA of the volume. The EMA is calculated over a period of 4 bars.
This line calculates the difference between the value of a1 and the volume-weighted moving average (VWMA) of the close price. The VWMA is calculated over a period of 8 bars.
This line calculates a3 as twice the VWMA of a2 over a period of 8 bars, minus the VWMA of a2 over a period of 16 bars.
This line plots the value of a3 on the chart. The color of the plot is determined by the condition inside the color argument. If a3 is within 20% of its previous value (a3[3]) in either direction, the color is set to silver. Otherwise, if a3 is greater than 0, the color is set to green; otherwise, it is set to red. The linewidth parameter sets the thickness of the plot, and the style parameter specifies that circles should be used to plot the values.
These lines plot two horizontal lines on the chart, one at 80% of the previous a3 value (a3[3]*0.8) and the other at 120% of the previous a3 value (a3[3]*1.2). The transp=100 parameter makes the lines transparent. The fill function is then used to fill the area between these lines with either a red or green color, depending on whether a3 at the current bar is greater or smaller than the corresponding values.
This line plots a horizontal line at a value of 0 on the chart. The color is set to gray, and the line width is set to 2.
Overall, this indicator calculates the values of a1, a2, and a3 based on moving averages and
Phát hành các Ghi chú
Added Sar Ema ColumnsMã nguồn mở
Theo đúng tinh thần TradingView, tác giả của tập lệnh này đã công bố nó dưới dạng mã nguồn mở, để các nhà giao dịch có thể xem xét và xác minh chức năng. Chúc mừng tác giả! Mặc dù bạn có thể sử dụng miễn phí, hãy nhớ rằng việc công bố lại mã phải tuân theo Nội quy.
Thông báo miễn trừ trách nhiệm
Thông tin và các ấn phẩm này không nhằm mục đích, và không cấu thành, lời khuyên hoặc khuyến nghị về tài chính, đầu tư, giao dịch hay các loại khác do TradingView cung cấp hoặc xác nhận. Đọc thêm tại Điều khoản Sử dụng.
Mã nguồn mở
Theo đúng tinh thần TradingView, tác giả của tập lệnh này đã công bố nó dưới dạng mã nguồn mở, để các nhà giao dịch có thể xem xét và xác minh chức năng. Chúc mừng tác giả! Mặc dù bạn có thể sử dụng miễn phí, hãy nhớ rằng việc công bố lại mã phải tuân theo Nội quy.
Thông báo miễn trừ trách nhiệm
Thông tin và các ấn phẩm này không nhằm mục đích, và không cấu thành, lời khuyên hoặc khuyến nghị về tài chính, đầu tư, giao dịch hay các loại khác do TradingView cung cấp hoặc xác nhận. Đọc thêm tại Điều khoản Sử dụng.