PROTECTED SOURCE SCRIPT
Order Imbalance Radar

🧭 Overview
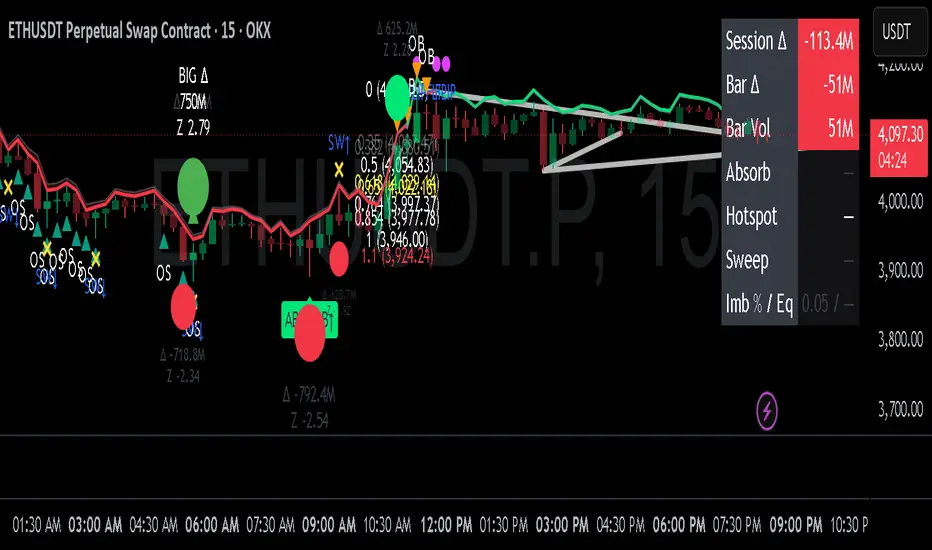
Order Imbalance Radar is a sophisticated volume–flow and imbalance detection system designed to visualize real-time shifts in buyer–seller dominance, absorption events, and market equilibrium. It combines delta-volume analysis, volatility filtering, and orderflow-style signals to help identify high-probability zones of reversal, continuation, or liquidity imbalance.
The indicator includes a top-right analytical dashboard, visual imbalance bubbles, and multiple overlays (absorption, overbought/oversold hotspots, equilibrium ribbon, liquidity sweeps, and session delta tracking).
⚙️ Core Logic & Signal Framework
1. Delta Volume Z-Score Model
Calculates delta (buy vs. sell volume) per bar based on directional close changes.
Uses a z-score normalization of delta over a user-defined lookback (zLookback) to detect statistically significant imbalances.
Highlights two tiers of imbalance:
Normal Imbalance (|z| ≥ zThresh1)
Big Imbalance (|z| ≥ zThresh2)
Filters results by requiring volume ≥ moving average × minVolMul.
Optionally limits signals to volatility squeeze conditions (via Bollinger Band width).
Visual Output:
✅ Green/red bar tints show intensity of buyer/seller imbalance.
🟢/🔴 Circle bubbles with Δ and Z-score values mark detected imbalances.
2. Absorption Detection
Detects bars where price rejects continuation despite high delta extremes, suggesting absorption of aggressive orders by passive liquidity.
Conditions:
|zΔ| exceeds absorbZ threshold
Candle body ≤ % of total range
Opposite wick ≥ % of range
Markers:
🟢 “ABSORB↑” below bars = buyer absorption (sellers absorbed)
🔴 “ABSORB↓” above bars = seller absorption (buyers absorbed)
3. OB/OS Hotspots
Integrates RSI and Bollinger Band positioning to identify volume-confirmed overbought/oversold zones.
Overbought → RSI ≥ rsiOB and price above upper band or high volume.
Oversold → RSI ≤ rsiOS and price below lower band or high volume.
Markers:
🔶 “OB” for overbought zones
🟩 “OS” for oversold zones
These can indicate short-term exhaustion points, particularly when confluenced with imbalance or absorption.
4. Liquidity Sweeps
Identifies stop-hunts / failed breakouts within recent swing lookback:
Sweep Up: Price makes a higher high but closes below previous swing → likely liquidity grab above highs.
Sweep Down: Price makes a lower low but closes above previous swing → liquidity grab below lows.
Markers:
“SW↑” (yellow) = bullish sweep
“SW↓” (yellow) = bearish sweep
5. Equilibrium Map & Ribbon
Analyzes rolling imbalance ratio (Δ / total volume) over a sliding window to gauge market equilibrium vs. imbalance bias.
Plots a dynamic ribbon above price scaled by ATR.
Ribbon color:
🟢 = buyer-dominant imbalance
🔴 = seller-dominant imbalance
Gray band marks the equilibrium zone (|imbalance| ≤ eqBand).
Fuchsia “FLIP” marker signals a change in imbalance polarity.
This provides a macro order-flow bias visualization.
6. Session Dashboard (Top-Right)
Compact dashboard showing real-time flow metrics within a defined trading session (e.g., 09:30–16:00):
Metric Description
Session Δ Total cumulative delta since session start
Bar Δ Current bar delta (buy vs. sell flow)
Bar Vol Bar volume relative to average
Absorb “BUY” / “SELL” / “—”
Hotspot “OB” / “OS” / “—”
Sweep “UP” / “DN” / “—”
Imb % / Eq Imbalance ratio & equilibrium state
Colors dynamically adapt to flow direction (green/red/fuchsia/gray).
7. CumDelta Line
Optional cumulative delta plot for continuous volume-flow tracking.
Helps confirm bias shifts and divergence vs. price.
🧩 Alerts
Pre-built alert conditions for all key events:
Buyer/Seller Imbalances
BIG Buyer/Seller Imbalances
Absorption (Buy/Sell)
Hotspot Overbought/Oversold
Liquidity Sweeps (Up/Down)
Equilibrium Flips
These allow automated alerts for advanced orderflow setups or backtesting triggers.
For More Premium Indicators please visit whop.com/ztcryptolab
Mã được bảo vệ
Tập lệnh này được đăng dưới dạng mã nguồn đóng. Tuy nhiên, bạn có thể tự do sử dụng tập lệnh mà không có bất kỳ hạn chế nào – tìm hiểu thêm tại đây.
Make your Money work for you !
Don’t worry — you don’t need to be a pro to start. I’ve got a community and tools that make it super easy to learn and actually understand what’s going on in the markets.
Check it out here 👉 whop.com/ztcryptolab/
Don’t worry — you don’t need to be a pro to start. I’ve got a community and tools that make it super easy to learn and actually understand what’s going on in the markets.
Check it out here 👉 whop.com/ztcryptolab/
Thông báo miễn trừ trách nhiệm
Thông tin và ấn phẩm không có nghĩa là và không cấu thành, tài chính, đầu tư, kinh doanh, hoặc các loại lời khuyên hoặc khuyến nghị khác được cung cấp hoặc xác nhận bởi TradingView. Đọc thêm trong Điều khoản sử dụng.